Below are the monthly updates from the most current May 2020 fuel price data (GasBuddy.com) and March 2020 electricity and natural gas price data (US Energy Information Agency). To view additional data and analysis related to the California economy visit our website at www.centerforjobs.org/ca.
While easing slightly for gasoline, the level of California energy prices compared to the rest of the US remain high as a result of the state’s regulatory mandates. These much higher costs will take on added significance as the state moves forward with its fledgling restart and recovery period.
Current projections from the Governor and Legislative Analysts’ Office anticipate a relatively prolonged recovery period, with job levels not recovering until after 2024. These conditions consequently would be similar to the slow recovery just experienced by the state from the recession that began in 2008. The key difference is that energy is starting at a much higher price point and will continue to grow higher as additional components on tap in the regulatory programs continue to come into play.
For households, these higher costs will continue to command a higher relative share of incomes compared to other states, both from direct payments for gasoline and utilities but also for other goods and services as the energy costs are incorporated into prices for everyday purchases. Recovery will be more challenging as the energy-related components in the cost of living continue to rise, especially if job markets are slow to recover as projected and growth in household incomes remains behind the growth in costs.
For employers, these higher prices apply directly to the costs of operation, and mean currently constrained cash flow resources going to regulation-driven costs rather than resumption of prior job levels. In most other parts of the US, the current lower energy prices will serve to help accelerate the recovery. In California, costs will continue to rise and have the opposite effect.
The extent of these cost barriers is illustrated in the charts below comparing the most recent California energy price levels contained in this report to those in other regions.
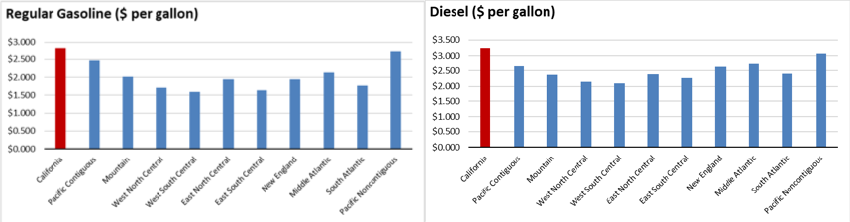
California vs. US Diesel Price
Above US Average
(CA Average)
The May average price per gallon of diesel in California eased 12 cents from April to $3.24. The California premium above the average for the US other than California ($2.36) eased to 88.4 cents, a 37.5% difference.
In May, California had the 2nd highest diesel price among the states and DC, behind only Hawaii.
Range Between Highest and Lowest Prices by Region
Above US Average
(Central Coast Region)
The cost premium above the US (other than California) average price for regular gasoline ranged from $0.80 in the Central Valley Region (average May price of $2.65), to $1.08 in Central Coast Region (average May price of $2.93).
Highest/Lowest Fuel Prices by Legislative District:
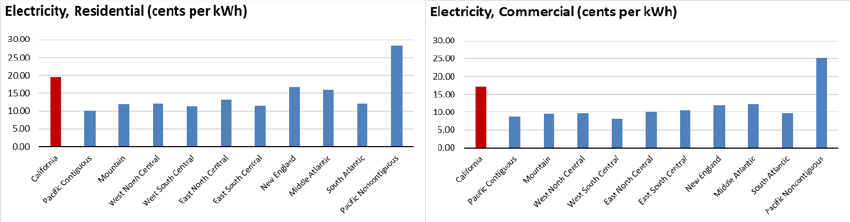
California Residential Electricity Price
Rest of US
California average Residential Price for the 12 months ended March 2020 was 19.57 cents/kWh, 54.6% higher than the US average of 12.66 cents/kWh for all states other than California. California’s residential prices remained the 7th highest in the nation.
California Residential Electric Bill
For the 12 months ended March 2020, the average annual Residential electricity bill in California was $1,225, or 23.2% higher ($231) than the comparable bill in 2010 (the year the AB 32 implementation began with the Early Action items). In this same period, the average US (less CA) electricity bill for all the other states grew only 1.0% ($14).
Residential bills, however, vary widely by region, with the estimated annual household usage in 2018 as much as 59% higher in the interior regions compared to the milder climate coastal areas.
US Average Price
For the 12 months ended March 2020, California’s higher electricity prices translated into Residential ratepayers paying $6.0 billion more than the average ratepayers elsewhere in the US using the same amount of energy.
California Commercial Electricity Price
Rest of US
California average Commercial Price for the 12 months ended March 2020 was 17.06 cents/kWh, 69.4% higher than the US average of 10.07 cents/kWh for all states other than California. California’s commercial prices remained the 3rd highest in the nation.
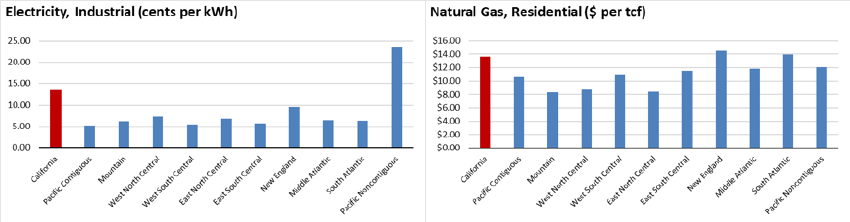
California Industrial Electricity Price
Rest of US
California average Industrial Price for the 12 months ended March 2020 was 13.67 cents/kWh, 113.6% higher than the US average of 6.40 cents/kWh for all states other than California. California’s industrial prices remained the 5th highest in the nation.
US Average Price
For the 12 months ended March 2020, California’s higher electricity prices translated into Commercial & Industrial ratepayers paying $11.2 billion more than ratepayers elsewhere in the US using the same amount of energy.
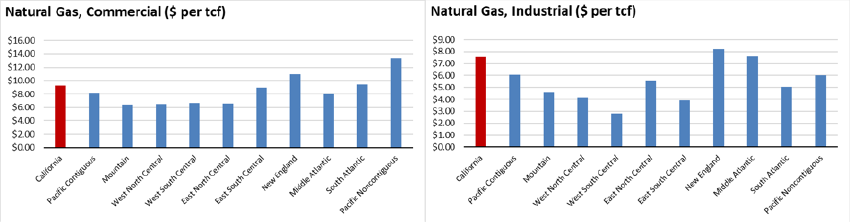
California Natural Gas Prices
Average prices ($ per thousand cubic feet) for the 12 months ended March 2020 and changes from the previous 12-month period for each end user: