Below are the monthly updates from the most current May 2021 fuel price data (GasBuddy.com) and March 2021 electricity and natural gas price data (US Energy Information Administration).
The average annual residential electric bill in California as of March surpassed the average for the rest of the US for the first time. Passing this milepost is key on at least two counts.
First, the current policy framework driving up electricity costs was put in place largely on the contention that while rates would likely increase some, rates didn’t really matter. In defending SB 100 (Chapter 312, Statutes of 2018) requiring the state to shift to 100% zero-emissions electricity by 2045, proponents in fact claimed that somewhat higher rates were not a cause of concern, because “. . . There is a difference between rates and retail. When it comes to utility bills for residential customers, we are actually the fourth lowest in the United States . . .” The fact that in the course of a decade California went from among the lowest to the 21st highest illustrates again the lack of hard economic analysis in the development of the state’s climate strategies, and more critically in the evaluation of the various measures as they have been rolled out.
Moreover, this contention was never really that correct. While higher-income households have been able to afford to live in the milder climate coastal areas and experience the economic benefits of lower utility costs, the lower income interior regions have always had to use more energy for heating and cooling. The most recent data from the Energy Commission indicates that household electricity use ranges up to 76% higher in the interior regions compared to the milder climate coastal areas, and substantially higher when compared against the lowest use county (San Francisco). The lower-income interior regions consequently have faced a much higher disparate cost effect from the rapidly rising energy rates in the state.
Second, costs matter whether reflected in rates or in total billings especially when the rates have risen so much—64.1% higher for residential, 77.5% higher for commercial, and 128.0% higher for industrial since the beginning of the state’s climate change program.
State policy has rightly been concerned about wage and income divides in our economy. The May Budget Revise emphasizes this point by casting many of the proposals as essential to attaining “an equitable recovery.” But state actions have only looked at one side of the equation.
In the period just prior to the pandemic, wages and incomes were rising as the economy grew close to full employment, and they were doing so in particular at faster rates for lower wage (1st Quintile), non-white, and Pacific Census Division (which includes California) workers as shown in the following charts from the Atlanta Fed’s Wage Tracker.
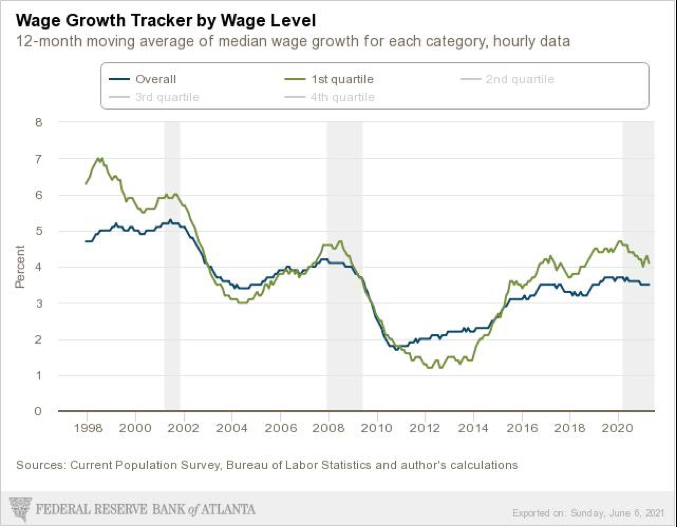
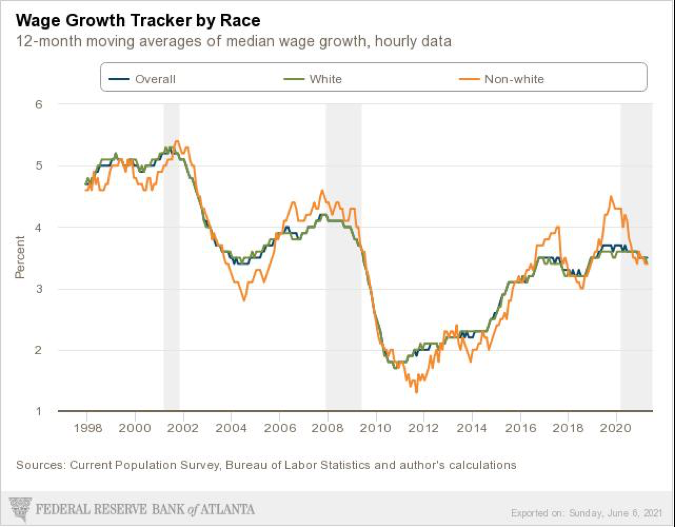
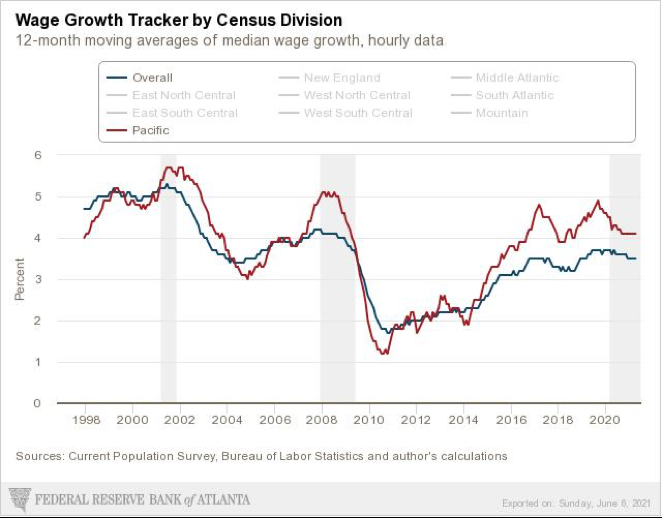
But rather than being able to move ahead economically, lower-income households in this state instead saw that wage progress relentlessly eroded by rises in the cost of energy and other core costs of living, in particular housing.
The cost of energy is not a discrete issue. Energy costs are a key component of the full monthly cost of housing. They affect the costs of commuting and consequently the choices available for housing and for jobs. And they work their way into higher prices for every other good and service on which households depend for basic needs. Several of these interactions are explored in detail on the Center’s Affordability Index website.
True adherence to equitable recovery and in the longer term, a more equitable economy means looking at both sides of the household budget—what they are earning and what those earnings are able to buy. Simply pretending that new regulations will be affordable skips over the analysis required to address these issues, both in the context of an individual regulation and the full range of regulatory costs imposed by the agencies each year. The energy regulations were passed on the premise that they would be affordable because the proponents said they would be. As it is turning out, they are not and they are continuing to add to the high cost barriers to being able to live, work, and progress economically in this state.
California vs. US Diesel Price
Above US Average
(CA Average)
The May average price per gallon of diesel in California rose 9 cents from April to $4.15. The California premium above the average for the US other than California ($3.10) was $1.05, a 33.9% difference.
In May, California had the 2nd highest diesel price among the states and DC, behind only Hawaii.
Range Between Highest and Lowest Prices by Region
Above US Average
(Central Sierra Region)
The cost premium above the US (other than California) average price for regular gasoline ranged from $1.11 in the Central Valley Region (average May price of $4.05), to $1.30 in Central Sierra Region (average May price of $4.24).
Highest/Lowest Fuel Prices By Legislative District:
California Residential Electricity Price
Rest Of US
California average Residential Price for the 12 months ended March 2021 was 20.86 cents/kWh, 64.1% higher than the US average of 12.71 cents/kWh for all states other than California. California’s residential prices remained the 6th highest in the nation.
California Residential Electric Bill Exceeds the Average for All Other States
For the 12 months ended March 2021, the average annual Residential electricity bill in California was $1,451, or 46.0% higher ($457) than the comparable bill in 2010 (the year the AB 32 implementation began with the Early Action items). In this same period, the average US (less CA) electricity bill for all the other states grew only 5.9% ($81). The March numbers mark the first time California costs exceeded the average for all other states ($1,446).
Residential bills, however, vary widely by region, with the estimated annual household usage in 2019 as much as 76% higher in the interior regions compared to the milder climate coastal areas, and substantially higher when comparing counties.
US Average Price
For the 12 months ended March 2021, California’s higher electricity prices translated into Residential ratepayers paying $7.9 billion more than the average ratepayers elsewhere in the US using the same amount of energy.
California Commercial Electricity Price
Rest Of US
California average Commercial Price for the 12 months ended March 2021 was 18.09 cents/kWh, 77.5% higher than the US average of 10.19 cents/kWh for all states other than California. California’s commercial prices remained the 3rd highest in the nation and the highest among the contiguous states.
California Industrial Electricity Price
Rest Of US
California average Industrial Price for the 12 months ended March 2021 was 14.68 cents/kWh, 128.0% higher than the US average of 6.44 cents/kWh for all states other than California. California’s industrial prices remained the 4th highest in the nation. Among the contiguous states, only Rhode Island was higher.
US Average Price
For the 12 months ended March 2021, California’s higher electricity prices translated into Commercial & Industrial ratepayers paying $12.0 billion more than ratepayers elsewhere in the US using the same amount of energy. Compared to the lowest rate states, Commercial & Industrial ratepayers paid $15.5 billion more.
California Natural Gas Prices
Average prices ($ per thousand cubic feet) for the 12 months ended March 2021 and changes from the previous 12-month period for each end user: