Highlights for policy makers:
- Unemployment Rate Holds at 7.4%; Total Employment Climbs 15,300
- Labor Force Participation Rate Remains At Lowest Level Since 1976
- Nonfarm Jobs Increase 70,900
- 8 Industries Remain Below 2007 Pre-Recession Job Levels; 11 Above
- 11 Counties Remain in Double-Digit Unemployment, Improved from 16 in August
- The Two-Tiered Economic Recovery Persists
Unemployment Rate Holds at 7.4%; Total Employment Climbs 15,300
The Labor Force data for August 2014 (seasonally adjusted; California preliminary) is shown below, along with the change from the prior month:
The related not seasonally adjusted numbers (California preliminary), with the change from August 2013:
California Employment Development Department’s (EDD) latest release shows generally positive results for August 2014. Total employment grew by 15,300. California’s seasonally adjusted unemployment rate remained unchanged from July at 7.4%, the lowest since Q3 2008. The not seasonally adjusted rate dropped 0.5 points from July 2014 to 7.4% in August 2014, and was down 1.5 points from August 2013. On a seasonally adjusted basis, the number of unemployed grew by 1,100 compared to July 2014.
By comparison, total US employment basically remained unchanged from July (seasonally adjusted increase of 16,000), while the number of unemployed decreased 0.8% (seasonally adjusted decrease of 80,000).
With a small decline in the US rate, California’s seasonally adjusted unemployment rate now stands 21% higher than the national rate. California was tied with Michigan and Tennessee for the 8th highest unemployment rate.
Between August 2013 and August 2014, Bureau of Labor Statistics (BLS) data shows the total number of employed increased by 386,141 (not seasonally adjusted). This increase was the highest among the states, ahead of Texas (284,896) and Florida (262,505).
Labor Force Participation Rate Remains At Lowest Since 1976
The state’s seasonally adjusted labor force participation remained unchanged at its lowest point in the current BLS data series, which has tracked this statistic from January 1976 to present.
Nonfarm Jobs Increase 70,900
EDD reported that between July and August 2014, not seasonally adjusted nonfarm payroll jobs increased by 70,900. Seasonally adjusted, nonfarm payroll jobs grew by 44,200.
Looking at the not seasonally adjusted numbers, the change in nonfarm payroll jobs from July 2014 saw the largest increases in Administrative and Support and Waste Services (14,500), Construction (14,600), and Manufacturing (10,200). Biggest declines were in Arts, Entertainment and Recreation (-5,400), Wholesale Trade (-2,500), and Retail Trade (-1,400). Overall, Total Nonfarm payroll jobs increased 70,900 from July.
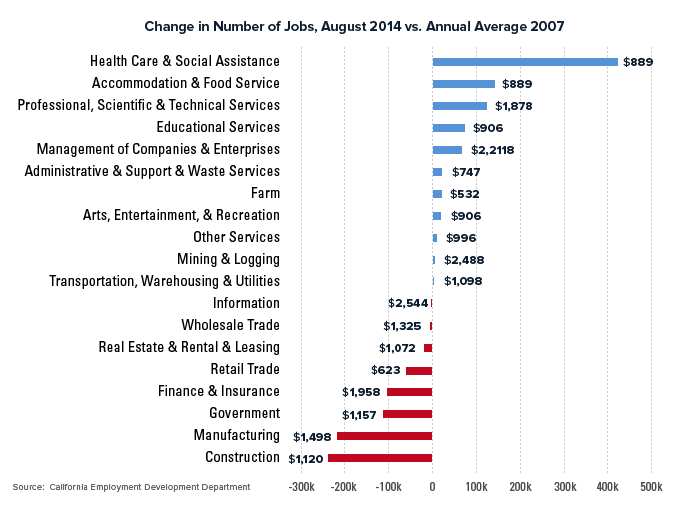
8 Industries Remain Below 2007 Pre-Recession Job Levels; 11 Above

Comparing the number of jobs by industry in August 2014 (seasonally adjusted), 8 industries remain below the 2007 pre-recession levels and 11 are above. As indicated in the figure above, growth has been primarily in the lower wage and higher wage industries. Middle class wage industries such as Manufacturing and Construction remain well below the 2007 levels.
The highest growth industry, Health Care & Social Assistance, includes government-paid IHSS workers under the Social Assistance component.
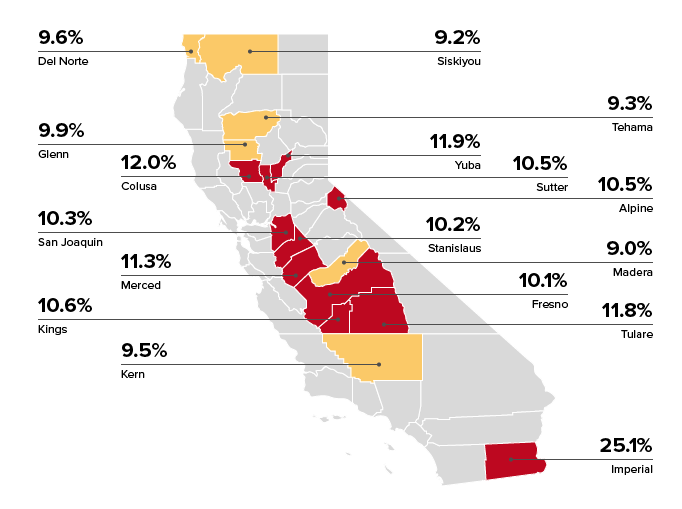
11 Counties Remain in Double-Digit Unemployment, Improved from 16 in August

The Two-Tiered Economic Recovery Persists
Unemployment rates and employment (all data is not seasonally adjusted) continue to vary widely across the state, although the spread between regions continued to drop from 1.95 in July to 1.89 in August.
By County:
Ratio of Highest to Lowest Rate: 5.98
By Legislative District:
Ratio of Highest to Lowest Rate: Senate 2.90
Ratio of Highest to Lowest Rate: Assembly 3.99
