Highlights for policy makers:
- Unemployment Rate Eases to 5.5%; Total Employment Rises 57,300
- Labor Force Participation Rate Improves to 62.2%
- State Employment Growth Rankings
- Nonfarm Jobs Increase 63,100
- Five Industries Below 2007 Pre-Recession Job Levels
- Two-Tier Economy Persists
- Eight California MSAs in the 10 Worst Unemployment Rates Nationally
- Broader Unemployment Measures Ease but Remain Above Pre-Recession Levels
- Farm Output Drops 14.3% in 2015
Unemployment Rate Rises to 5.5%; Total Employment Up 57,300
The Labor Force data for August 2016 (seasonally adjusted; California preliminary) is shown below, along with the change from the prior month:
| Seasonally Adjusted | California | US | ||
|---|---|---|---|---|
| Aug 2016 | Change from Jul 2016 | Aug 2016 | Change from Jul 2016 | |
| Unemployment Rate | 5.5 | 0 | 4.9 | 0.0 |
| Labor Force | 19,231,000 | 0.4% | 159,463,000 | 0.1% |
| Participation Rate | 62.2 | 0.1 | 62.8 | 0.0 |
| Employment | 18,170,300 | 0.3% | 151,614,000 | 0.1% |
| Unemployment | 1,060,600 | 1.1% | 7,849,000 | 1.0% |
The related not seasonally adjusted numbers (California preliminary), with the change from August 2015:
| Not Seasonally Adjusted | California | US | ||
|---|---|---|---|---|
| Aug 2016 | Change from Aug 2015 | Aug 2016 | Change from Aug 2015 | |
| Unemployment Rate | 6.1 | 0.0 | 5.0 | -0.2 |
| Labor Force | 19,557,668 | 2.9% | 159,800,000 | 1.5% |
| Participation Rate | 62.7 | 0.5 | 62.9 | 0.2 |
| Employment | 18,374,498 | 3.0% | 151,804,000 | 1.7% |
| Unemployment | 1,183,170 | 2.1% | 7,996,000 | -2.0% |
California Employment Development Department’s (EDD) latest release shows on a seasonally adjusted basis, total employment grew by 57,300 from July, while the number of unemployed grew by 12,000. California’s seasonally adjusted unemployment rate remained steady from the prior month at 5.5%. California tied with Illinois and Wyoming for the 13th highest unemployment rate among the states. The unadjusted rate remained unchanged from August 2015 at 6.1%.
Total US employment saw a seasonally adjusted increase of 97,000 from July, while the number of unemployed increased by 79,000. The national unemployment rate remained level at 4.9%.
Labor Force Participation Rate Improves to 62.2%
California’s participation rate (seasonally adjusted) rose 0.1 point to 62.2% in August. The comparable US rate remained level at 62.8%. While the participation rate has been showing its first improvement in a year, the overall rate still remains near the previous lows from 1976, and well below the average pre-recession level of 65.6% in 2007.
State Employment Growth Rankings
| Rank | Number of Employed | Percentage Change | Population Adjusted (employment growth per 1,000 civilian noninstitutional population) |
|---|---|---|---|
| 1 | CA 354,472 | OR 5.0% | OR 28.9 |
| 2 | TX 198,642 | TN 3.9% | TN 21.5 |
| 3 | GA 162,269 | GA 3.6% | GA 20.8 |
| 4 | FL 116,804 | IN 3.4% | IN 20.8 |
| 5 | TN 111,326 | AR 3.0% | DE 16.9 |
| 6 | IN 106,464 | DE 2.8% | AR 16.7 |
| 7 | NC 96,272 | SC 2.6% | NH 16.1 |
| 8 | OR 93,431 | NH 2.4% | CO 15.4 |
| 9 | MI 89,977 | CO 2.4% | DC 14.6 |
| 10 | WA 80,278 | WA 2.4% | WA 14.2 |
| 11 | IL 75,360 | AZ 2.3% | SC 14.2 |
| 12 | MA 72,995 | DC 2.2% | ND 13.7 |
| 13 | OH 68,117 | MA 2.1% | UT 13.6 |
| 14 | AZ 67,856 | NC 2.1% | MA 13.3 |
| 15 | CO 65,631 | UT 2.1% | AZ 12.8 |
| 16 | SC 54,553 | MI 2.0% | NC 12.3 |
| 17 | WI 43,751 | ND 2.0% | ID 12.1 |
| 18 | MD 39,663 | CA 2.0% | ME 11.8 |
| 19 | AR 38,347 | ME 2.0% | CA 11.6 |
| 20 | PA 36,022 | ID 2.0% | MI 11.4 |
| 21 | KY 33,792 | KY 1.8% | KY 9.8 |
| 22 | UT 29,239 | TX 1.6% | TX 9.7 |
| 23 | AL 28,676 | WI 1.5% | WI 9.6 |
| 24 | NJ 18,384 | WV 1.5% | SD 8.7 |
| 25 | NH 17,448 | AL 1.4% | MD 8.4 |
| US 2,571,000 | US 1.7% | US 10.1 | |
| 0.0% | 0.0 |
Between August 2015 and August 2016, Bureau of Labor Statistics (BLS) data shows the total number of employed in California increased by 354,472 (seasonally adjusted), or 13.8% of the total net employment gains in this period for the US. Measured by percentage change in employment over the year, California was 18th highest. Adjusted for population, California ranked 19th.
Nonfarm Jobs Increase 63,100
EDD reported that between July and August 2016, seasonally adjusted nonfarm payroll jobs increased by 63,100. July’s gains were revised downwards by nearly half to 18,600 from the previously reported gain of 36,400.
Looking at the not seasonally adjusted numbers, hiring saw increases in all but 2 industries. The change in total payroll jobs from August 2015 saw the largest increases in Health Care & Social Services (61,800), Professional, Scientific & Professional Services (56,200), and Government (43,400). Declines were in Manufacturing (-10,700) and Mining & Logging (-3,300).
| Not Seasonally Adjusted Payroll Jobs | Jul 2016 | Aug 2016 | Aug 2016 – Jul 2016 | Aug 2016 – Aug 2015 |
|---|---|---|---|---|
| Total Farm | 477,100 | 482,300 | 5,200 | 6,000 |
| Mining & Logging | 26,200 | 25,900 | -300 | -3,300 |
| Construction | 778,300 | 785,900 | 7,600 | 27,800 |
| Manufacturing | 1,302,700 | 1,307,200 | 4,500 | -10,700 |
| Wholesale Trade | 739,200 | 739,500 | 300 | 13,000 |
| Retail Trade | 1,681,100 | 1,683,500 | 2,400 | 22,400 |
| Transportation, Warehousing & Utilities | 564,700 | 572,600 | 7,900 | 9,100 |
| Information | 496,100 | 502,200 | 6,100 | 13,400 |
| Finance & Insurance | 531,100 | 532,400 | 1,300 | 1,600 |
| Real Estate & Rental & Leasing | 284,300 | 284,700 | 400 | 9,100 |
| Professional, Scientific & Technical Services | 1,266,300 | 1,277,100 | 10,800 | 56,200 |
| Management of Companies & Enterprises | 236,100 | 235,700 | -400 | 4,700 |
| Administrative & Support & Waste Services | 1,081,500 | 1,090,600 | 9,100 | 18,700 |
| Educational Services | 341,800 | 338,800 | -3,000 | 20,200 |
| Health Care & Social Assistance | 2,176,400 | 2,184,700 | 8,300 | 61,800 |
| Individual & Family Services | 588,300 | 595,000 | 6,700 | 18,200 |
| Arts, Entertainment, & Recreation | 326,800 | 326,100 | -700 | 25,500 |
| Accommodation & Food Service | 1,605,300 | 1,609,900 | 4,600 | 41,000 |
| Other Services | 554,500 | 552,400 | -2,100 | 1,700 |
| Government | 2,368,900 | 2,401,600 | 32,700 | 43,400 |
| Total Nonfarm | 16,361,300 | 16,450,800 | 89,500 | 355,600 |
| Total Wage & Salary | 16,838,400 | 16,933,100 | 94,700 | 361,600 |
By total number of new jobs, California had the highest increase in seasonally adjusted nonfarm jobs among the states from August 2015 to August 2016, at 378,000 or 15.4% of the US net increase. By percentage growth in jobs, California was 12th highest, and by population adjusted jobs growth, 17th highest.
| Rank | Number of Jobs | Employment Growth (%) | Population Adjusted (job growth per 1,000 civilian noninstitutional population) |
|---|---|---|---|
| 1 | CA 378,000 | OR 3.3% | DC 23.4 |
| 2 | FL 259,800 | ID 3.3% | UT 19.5 |
| 3 | TX 190,600 | FL 3.2% | OR 18.0 |
| 4 | GA 104,000 | UT 3.1% | ID 17.4 |
| 5 | NY 102,500 | NV 2.9% | CO 16.5 |
| 6 | WA 88,800 | CO 2.8% | DE 16.5 |
| 7 | OH 78,300 | WA 2.8% | NV 16.1 |
| 8 | MI 75,800 | DE 2.8% | FL 15.6 |
| 9 | NC 74,800 | SC 2.5% | SD 15.5 |
| 10 | VA 72,500 | GA 2.4% | WA 15.5 |
| 11 | CO 71,600 | SD 2.4% | GA 13.2 |
| 12 | MA 68,100 | CA 2.3% | SC 13.0 |
| 13 | TN 64,000 | TN 2.2% | IA 12.7 |
| 14 | OR 59,100 | VT 2.1% | VT 12.6 |
| 15 | PA 55,800 | AZ 2.0% | MA 12.3 |
| 16 | AZ 54,000 | IA 2.0% | TN 12.2 |
| 17 | NJ 52,200 | NH 2.0% | CA 12.2 |
| 18 | SC 50,500 | MA 1.9% | NH 11.9 |
| 19 | MD 46,800 | VA 1.9% | VA 11.0 |
| 20 | UT 42,800 | MI 1.8% | AZ 10.1 |
| US 2,447,000 | US 1.7% | US 9.6 |
Five Industries Below 2007 Pre-Recession Job Levels
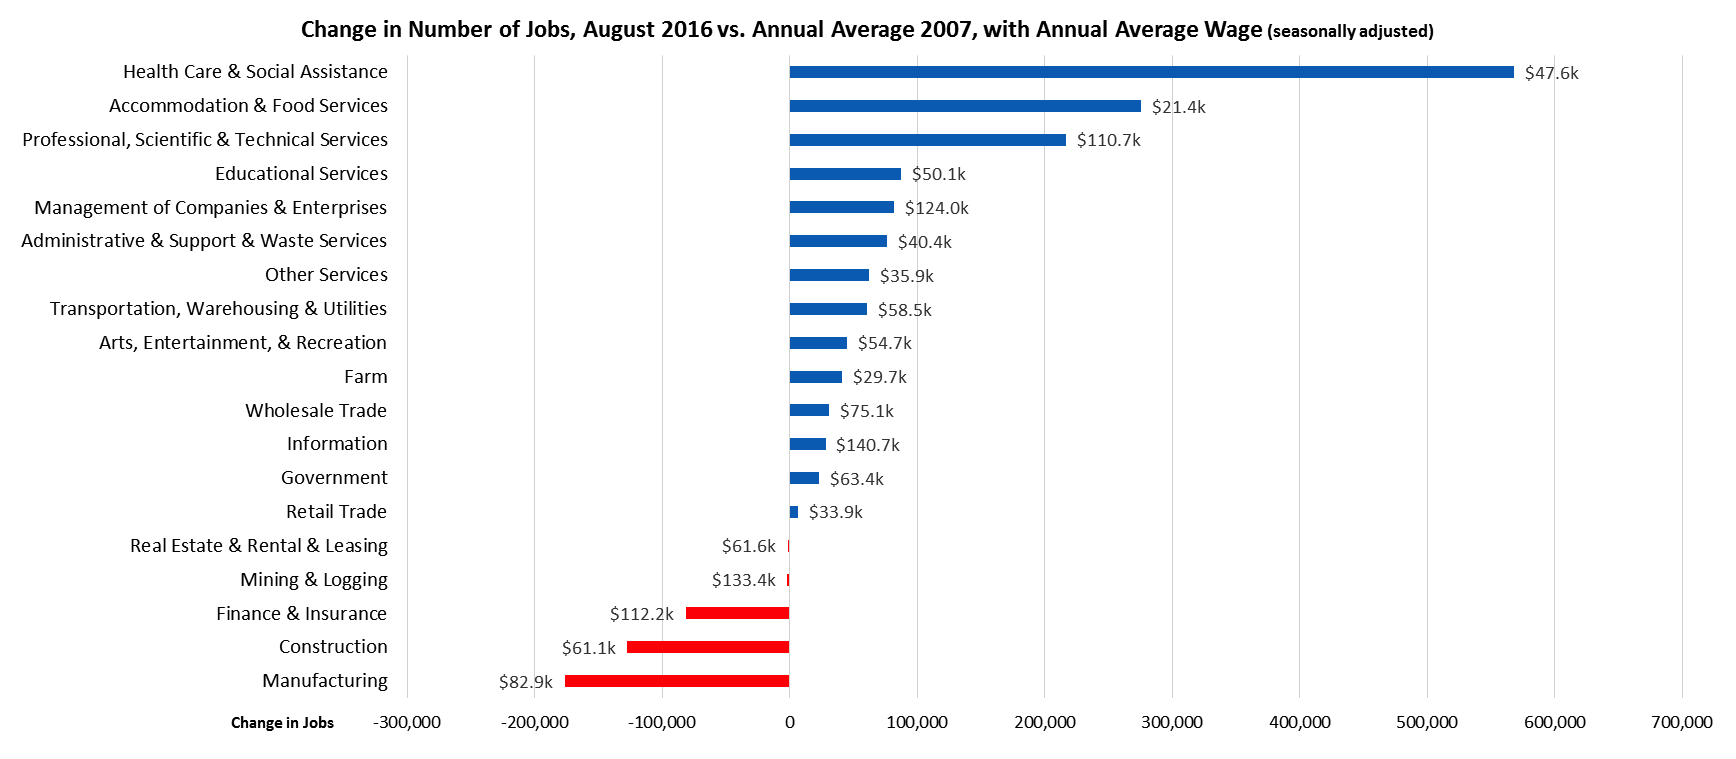
Comparing the number of jobs by industry in August 2016 (seasonally adjusted), 5 industries continued to experience employment below the 2007 pre-recession levels. In the highest gain industries, Health Care & Social Assistance remained the leading industry, followed by lowest wage Accommodation & Food Services and higher wage Professional, Scientific & Technical Services.
Two-Tier Economy Persists
Unemployment rates (all data is not seasonally adjusted) continue to vary widely across the state, ranging from 4.2% in the Bay Area to more than double at 8.9% in the Central Valley.
| Not Seasonally Adjusted | Unemployment Rate (%) August 2016 |
|---|---|
| California | 5.9 |
| Bay Area | 4.2 |
| Orange County | 4.4 |
| Los Angeles | 5.3 |
| Sacramento Region | 5.4 |
| Central Coast | 5.5 |
| Central Sierra | 5.7 |
| San Diego/Imperial | 5.9 |
| Inland Empire | 6.6 |
| Upstate California | 6.7 |
| Central Valley | 8.9 |
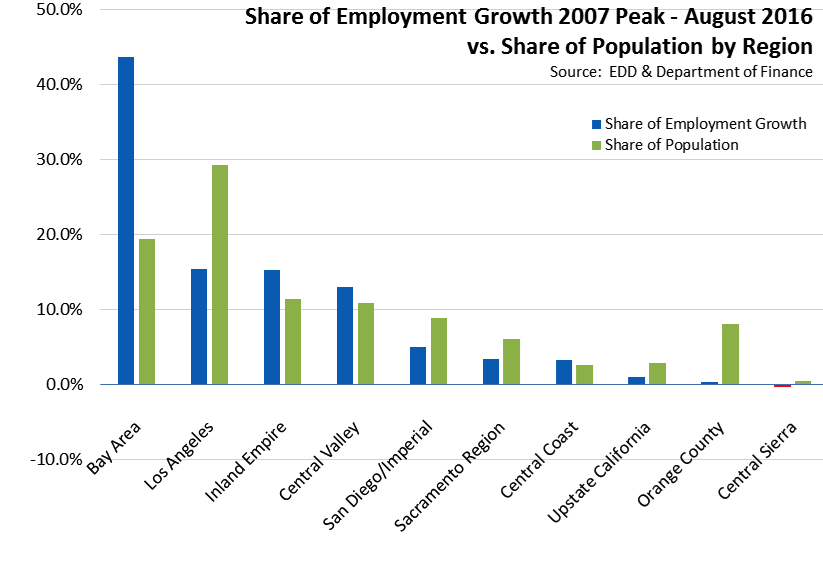
Containing just under 20% of the state’s population, the Bay Area contains 43.7% of the net growth in employment since the pre-recession peak in 2007. Los Angeles Region, while now containing the second highest amount of net employment growth, has only 15.4% of net employment gains and just under 30% of the total population.
By Legislative District:
| Lowest 10 Unemployment Rates | |||||
|---|---|---|---|---|---|
| CD18 (Eshoo-D) | 3.2 | SD13 (Hill-D) | 3.1 | AD22 (Mullin-D) | 3.0 |
| CD12 (Pelosi-D) | 3.3 | SD11 (Leno-D) | 3.5 | AD16 (Baker-R) | 3.0 |
| CD45 (Walters-R) | 3.5 | SD37 (Moorlach-R) | 3.8 | AD24 (Gordon-D) | 3.2 |
| CD14 (Speier-D) | 3.6 | SD26 (Allen-D) | 3.9 | AD28 (Low-D) | 3.3 |
| CD52 (Peters-D) | 3.6 | SD39 (Block-D) | 4.0 | AD17 (Chiu-D) | 3.5 |
| CD17 (Honda-D) | 3.7 | SD36 (Bates-R) | 4.1 | AD19 (Ting-D) | 3.6 |
| CD33 (Lieu-D) | 3.7 | SD15 (Beall-D) | 4.2 | AD77 (Maienschein-R) | 3.6 |
| CD27 (Chu-D) | 4.0 | SD07 (Glazer-D) | 4.3 | AD74 (Harper-R) | 3.7 |
| CD02 (Huffman-D) | 4.2 | SD25 (Liu-D) | 4.4 | AD66 (Hadley-R) | 3.7 |
| CD48 (Rohrabacher-R) | 4.2 | SD02 (McGuire-D) | 4.4 | AD73 (Brough-R) | 3.7 |
| Highest 10 Unemployment Rates | |||||
|---|---|---|---|---|---|
| CD44 (Hahn-D) | 7.3 | SD04 (Nielsen-R) | 6.5 | AD80 (Gonzalez-D) | 7.6 |
| CD36 (Ruiz-D) | 7.3 | SD28 (Stone-R) | 6.6 | AD64 (Gipson-D) | 7.6 |
| CD09 (McNerney-D) | 7.5 | SD20 (Leyva-D) | 6.6 | AD23 (Patterson-R) | 7.8 |
| CD10 (Denham-R) | 7.6 | SD31 (Roth-D) | 6.9 | AD34 (Grove-R) | 7.9 |
| CD41 (Takano-D) | 7.7 | SD08 (Berryhill-R) | 7.4 | AD13 (Eggman-D) | 8.3 |
| CD23 (McCarthy-R) | 8.4 | SD05 (Galgiani-D) | 7.6 | AD21 (Gray-D) | 9.5 |
| CD22 (Nunes-R) | 8.6 | SD12 (Cannella-R) | 8.0 | AD31 (Arambula-D) | 9.9 |
| CD16 (Costa-D) | 9.6 | SD16 (Fuller-R) | 8.4 | AD26 (Mathis-R) | 10.4 |
| CD21 (Valadao-R) | 10.7 | SD40 (Hueso-D) | 10.1 | AD32 (Salas-D) | 11.4 |
| CD51 (Vargas-D) | 11.8 | SD14 (Vidak-R) | 11.6 | AD56 (Garcia-D) | 14.0 |
Eight California MSAs in the 10 Worst Unemployment Rates Nationally
Of the 10 Metropolitan Statistical Areas (MSAs) with the worst unemployment rates nationally, 8 are in California. Of the 20 worst, 10 are in California.
| US Rank | MSA | Jul 2016 Unemployment Rate |
|---|---|---|
| 366 | Las Cruces, NM Metropolitan Statistical Area | 7.5 |
| 369 | Brownsville-Harlingen, TX Metropolitan Statistical Area | 7.7 |
| 369 | Longview, WA Metropolitan Statistical Area | 7.7 |
| 371 | Hammond, LA Metropolitan Statistical Area | 7.8 |
| 371 | Johnstown, PA Metropolitan Statistical Area | 7.8 |
| 371 | Lafayette, LA Metropolitan Statistical Area | 7.8 |
| 374 | Vineland-Bridgeton, NJ Metropolitan Statistical Area | 8.4 |
| 375 | Stockton-Lodi, CA Metropolitan Statistical Area | 8.5 |
| 376 | McAllen-Edinburg-Mission, TX Metropolitan Statistical Area | 8.6 |
| 377 | Modesto, CA Metropolitan Statistical Area | 8.9 |
| 378 | Yuba City, CA Metropolitan Statistical Area | 9.0 |
| 379 | Fresno, CA Metropolitan Statistical Area | 9.4 |
| 380 | Farmington, NM Metropolitan Statistical Area | 9.5 |
| 380 | Madera, CA Metropolitan Statistical Area | 9.5 |
| 382 | Hanford-Corcoran, CA Metropolitan Statistical Area | 9.6 |
| 383 | Merced, CA Metropolitan Statistical Area | 10.5 |
| 384 | Bakersfield, CA Metropolitan Statistical Area | 10.6 |
| 385 | Visalia-Porterville, CA Metropolitan Statistical Area | 11.3 |
| 386 | El Centro, CA Metropolitan Statistical Area | 24.2 |
| 387 | Yuma, AZ Metropolitan Statistical Area | 24.3 |
Broader Unemployment Measures Ease but Remain Above Pre-Recession Levels
The generally reported unemployment rate is only one of 6 unemployment measures tracked by the Bureau of Labor Statistics. These alternative rates vary from very narrowly defined measures, to broader underemployment measures accounting for persons who remain only marginally attached to the labor force:
- U-1, the most narrow, measures persons unemployed 15 weeks or longer
- U-2 covers job losers and persons who completed temporary jobs
- U-3, the official unemployment rate and the one generally reported, covers total unemployed
- U-4 covers U-3 plus discouraged workers
- U-5 covers U-4 plus all other marginally attached workers
- U-6, the broadest measure, cover U-5 plus total employed part time for economic reasons.
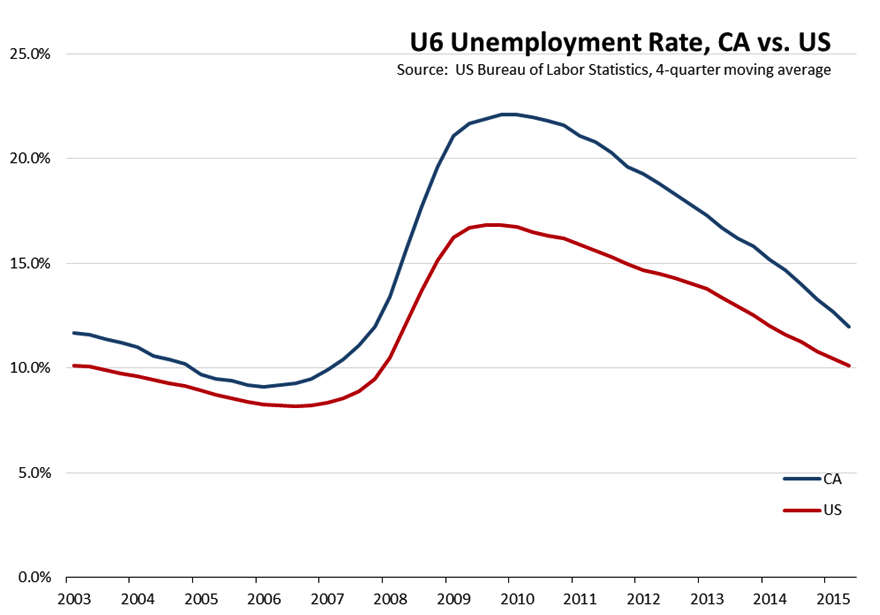
Looking at U-6, the most recently reported rate for the 2nd quarter of 2016 in California was 11.7% (4-quarter moving average), down from 12.0% in the 1st quarter. The comparable 2nd quarter US average was 9.9%. The California rate remained the 4th highest among the states, which ranged from 5.0% in South Dakota to 13.1% in Nevada.
The California U-6 rate also remains well above the pre-recession levels, another indication that while California’s economy has rebuilt from the recession lows, it still in many areas has yet to achieve a full recovery. The California U-6 rate compared to the US average is shown in the following figure. While the spread between the California and US average has been narrowing in recent quarters, both this spread and the levels have yet to return to those that existed prior to the recession.
Farm Output Drops 14.3% in 2015
USDA data shows California’s Total Farm Output plunged 14.3% in 2015, going from $58.7 billion in 2014 to $50.3 billion. Comparable data for the US as whole shows a smaller contraction of 5.1%, from $428.7 billion in 2014 to $406.7 billion in 2015.
Within California, Animal and Products Production experienced a relatively larger decline of 20.5% in value (drop of $3.1 billion). Crop Production was off 13.3%, but with a larger dollar decline of $5.3 billion. The contribution of other Farm-Related Income remained essentially level, with an increase of 0.9%.
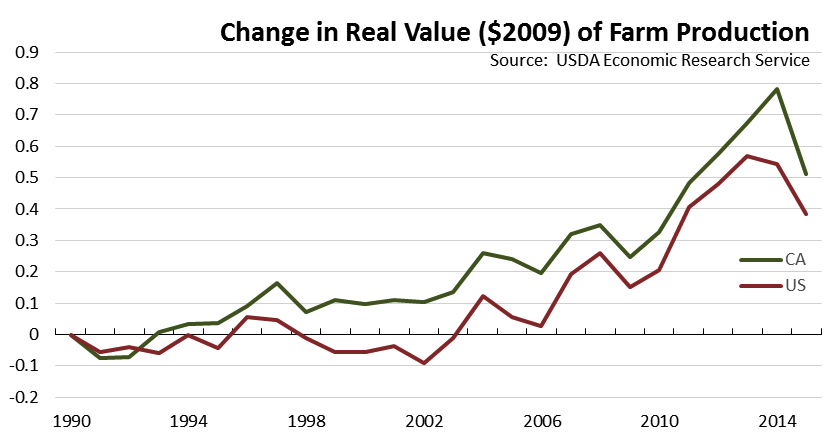
The chart below compares the real value ($2009) of farm production for the US and California, calculated as the change from 1990. The chart shows that California has managed to outpace growth for the US as a whole in most years, including the most recent drought years and the extended drought in the early 1990s. This growth has come as California agriculture has shifted to higher-value, often permanent crops such as grapes, nuts, and fruits and increased total farm-gate income through value-added innovations. These shifts, however, have made the industry more dependent on reliability in many production inputs, in particular water, labor, and access to markets.
The sharp drop in 2015 reflects the accumulation of a number of factors, including continued drought, increasing costs of alternative water supplies, softness in traditional export markets, and increasing cost of energy including fuels, electricity, and natural gas. Recent state decisions such as those related to water and labor wage regulations come against this backdrop of a steep shift in the direction of the industry’s growth.
Note: All data sources, methodologies, and historical data series available at CenterforJobs.org.