Highlights for policy makers:
- Unemployment Unchanged at 4.1%; Employment Up 5,400 for the Month but Down 34,500 for the Year
- Labor Force Participation Rate Level at 62.0%
- Employment Growth Ranking—California Plummets to 50th
- Nonfarm Jobs Up 34,500 for Month; California Regains #1 Rank for 12-month Gain
- Jobs Change by Industry
- Structural Shifts in State’s Economy
- Unemployment Rates by Region
- Unemployment Rates by Legislative District
- Employment Growth by Region
- MSAs with the Worst Unemployment Rates
- Chart of the Month: Jobs & Wage Growth by Region
Unemployment Unchanged at 4.1%; Employment Up 5,400 for the Month but Down 34,500 for the Year
EDD reported total employment (seasonally adjusted; August preliminary) was up 5,400 from the revised July numbers, while the number of unemployed dropped by 13,200. Unemployment rate was unchanged 4.1%. The unadjusted rate was down 0.1 point from the year earlier to 4.2%. California had the 12th highest unemployment rate among the states.
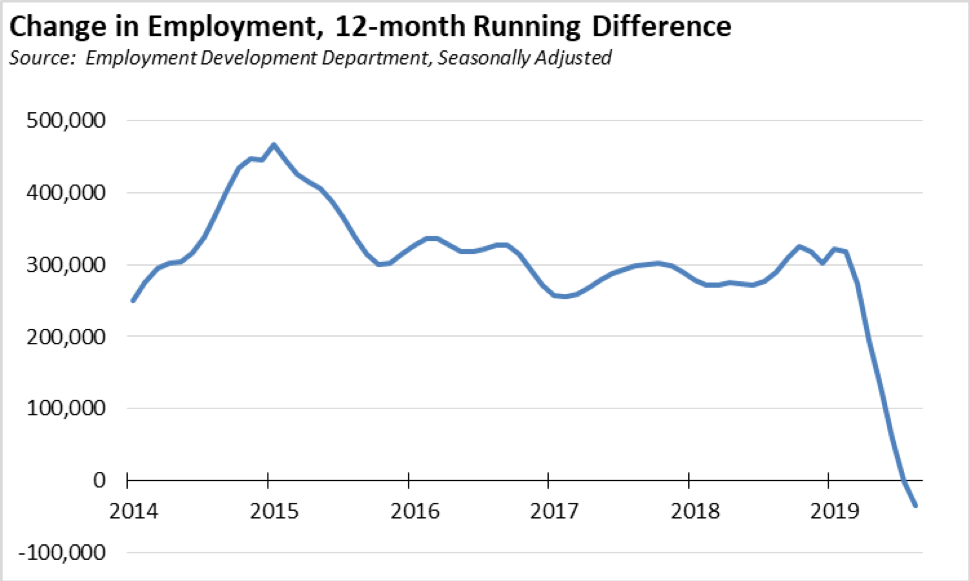
However, August was the second month in a row showing a year-over-year drop in employment. Viewed on this basis, after holding steady around a gain of about 300,000 since the second half of 2015, employment growth has been steadily declining since October 2018 and essentially stalled with a loss of 100 in July. In August, the employment level was 34,500 below the previous mark in August 2018. These numbers are based on the seasonally adjusted data, but the unadjusted data also shows a similar pattern as well.
While California continues to create jobs, the employment numbers illustrate starkly the increasing difficulty of filling them. Unlike conditions elsewhere in the US, workers in California are not being drawn back into the workforce, and remain on the sidelines of the continuing recovery at a higher rate.
Nationally, total US employment saw a seasonally adjusted gain of 590,000 for the month, with the number of unemployed dipping 19,000 as the national labor force continued to expand. The unemployment rate remained stable at 3.7%.
Figure Sources: California Employment Development Department; US Bureau of Labor Statistics
Labor Force Participation Rate Level at 62.0%
California’s seasonally adjusted labor force participation rate paused in its contraction trend and was unchanged at 62.0%. Nationally, the participation rate was up at 63.2%. With the gap again expanding, the state continues to experience lower than average participation rates in spite of having a relatively younger population than the rest of the US.
For the 12 months ending August 2019, the seasonally adjusted data shows the California labor force dipped by 41,600 (-0.2% growth) compared to the rest of the US with an expansion of 2.12 million (1.3%).
The continuing stall out in labor force growth has significant implications for the California economy. The increasing difficulty of finding qualified workers, and in some cases any workers, puts California businesses at a competitive disadvantage to other states where the expansion continues to draw workers into the labor force. At the same time, this situation produces caseload demands on state and local welfare and other social assistance budgets well above where they should be given the current circumstances of the recovery.
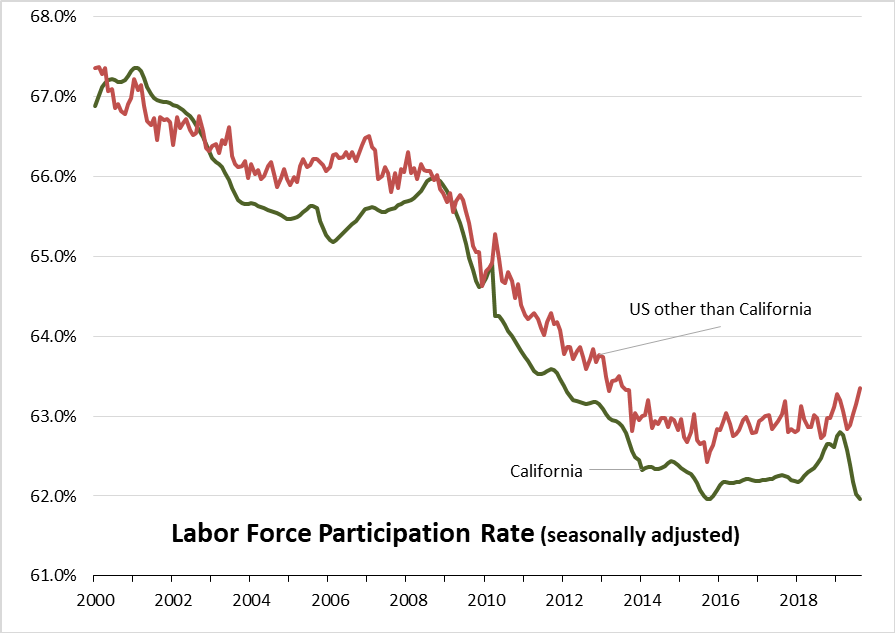
Figure Source: California Employment Development Department; US Bureau of Labor Statistics
Employment Growth Ranking—California Plummets to 50th
As indicated above, California’s employment shrank 34,500 when measured year-over-year. By this measure, California plummeted to 50th place among the states, ahead of only New York which showed a loss of 61,100. Texas led with an additional 216,400 persons employed over this period, and Florida in second place with a gain of 148,400.
Based on percentage growth, California had a 0.2% contraction in employment, below the average for the rest of the US which showed a gain of 1.1%. Ranked among the states, California’s growth rate dropped to 46th place, while Tennessee again led at 3.4%.
Figure Source: US Bureau of Labor Statistics
Nonfarm Jobs Up 34,500 for Month; California Regains #1 Rank for 12-month Gain
Nonfarm jobs (seasonally adjusted) were up 34,500 as July’s gains were revised to 16,200 from the previously reported 19,600.
For the 12 months ending August, total jobs growth was 314,200, putting the state in 1st place ahead of Texas 303,500 and Florida at 221,200.
Adjusting for population size, California came in at 14th among the states, with a 12-month jobs growth rate of 1.8%, still ahead of the 1.3% average for the rest of the nation.
Figure Sources: California Employment Development Department; US Bureau of Labor Statistics
Jobs Change by Industry
In the unadjusted numbers that allow a more detailed look at industry shifts, hiring saw increases in all but 2 industries over the year.
Gains in payroll jobs were led by Social Assistance ($19.8k average annual wages), Government ($70.1k), and Professional, Scientific & Technical Services ($122.5k).
Declines were in Retail Trade ($36.7k) as this portion of the economy continues to go through a structural shift in response to growing wage pressures from government mandates at the same time it is under competitive challenges from nontraditional sources, and Wholesale Trade ($78.3k).
All wage data is from the most current 4-quarter average from the Quarterly Census of Employment & Wages.
| wdt_ID | Not Seasonally Adjusted Payroll Jobs (1,000) | Aug 2019 | 12-month Change |
|---|---|---|---|
| 1 | Total Farm | 480.7 | 3.2 |
| 2 | Mining & Logging | 23.7 | 0.1 |
| 3 | Construction | 923.3 | 37.4 |
| 4 | Manufacturing | 1,355.4 | 11.6 |
| 5 | Wholesale Trade | 697.4 | -5.1 |
| 6 | Retail Trade | 1,667.1 | -13.8 |
| 7 | Utilities | 57.3 | 0.3 |
| 8 | Transportation & Warehousing | 623.3 | 13.0 |
| 9 | Information | 562.3 | 16.6 |
| 10 | Finance & Insurance | 545.9 | 1.9 |
| 11 | Real Estate & Rental & Leasing | 300.0 | 3.7 |
| 12 | Professional, Scientific & Technical Services | 1,330.2 | 40.5 |
| 13 | Management of Companies & Enterprises | 258.1 | 3.1 |
| 14 | Administrative & Support & Waste Services | 1,178.1 | 33.7 |
| 15 | Educational Services | 363.5 | 15.5 |
| 16 | Health Care | 1,574.3 | 21.6 |
| 17 | Social Assistance | 857.6 | 45.1 |
| 18 | Arts, Entertainment & Recreation | 329.0 | 2.9 |
| 19 | Accommodation | 243.9 | 8.2 |
| 20 | Food Services | 1,483.5 | 26.2 |
| 21 | Other Services | 577.5 | 0.7 |
| 22 | Government | 2,505.3 | 41.7 |
| 23 | Total Nonfarm | 17,456.7 | 304.9 |
| 24 | Total Wage & Salary | 17,937.4 | 308.1 |
Figure Source: California Employment Development Department
Structural Shifts in State’s Economy
Comparing current job numbers to the pre-recession levels in 2007 illustrates the structural shift in the state’s economy, with the primary jobs growth occurring in the higher and lower wage industries.
Jobs growth within the traditional middle class wage—especially blue collar industries such as Manufacturing, Mining & Logging, and Utilities—continues to lag. After stronger gains during the recovery, both Wholesale and Retail Trade have continued to show weakness, reflecting competitive pressures from nontraditional channels at the same time these industries have been weakened by state policies resulting in rising operating costs. Utilities continues to show weakness as the state’s energy policies result in the replacement of in-state generation with facilities having lower labor needs and with sources in other states. Finance & Insurance also remains in the negative column as companies have moved back office and other operations out of the state.
Construction for the first time shows a gain over the 2007 level, but still is 43,000 below the all-time peak in 2006. Construction is the primary blue collar industry gaining ground in the past year as activity has picked up in all areas except Residential Building Construction, which remains 19,600 below the 2007 level and 26,600 below the 2006 peak.
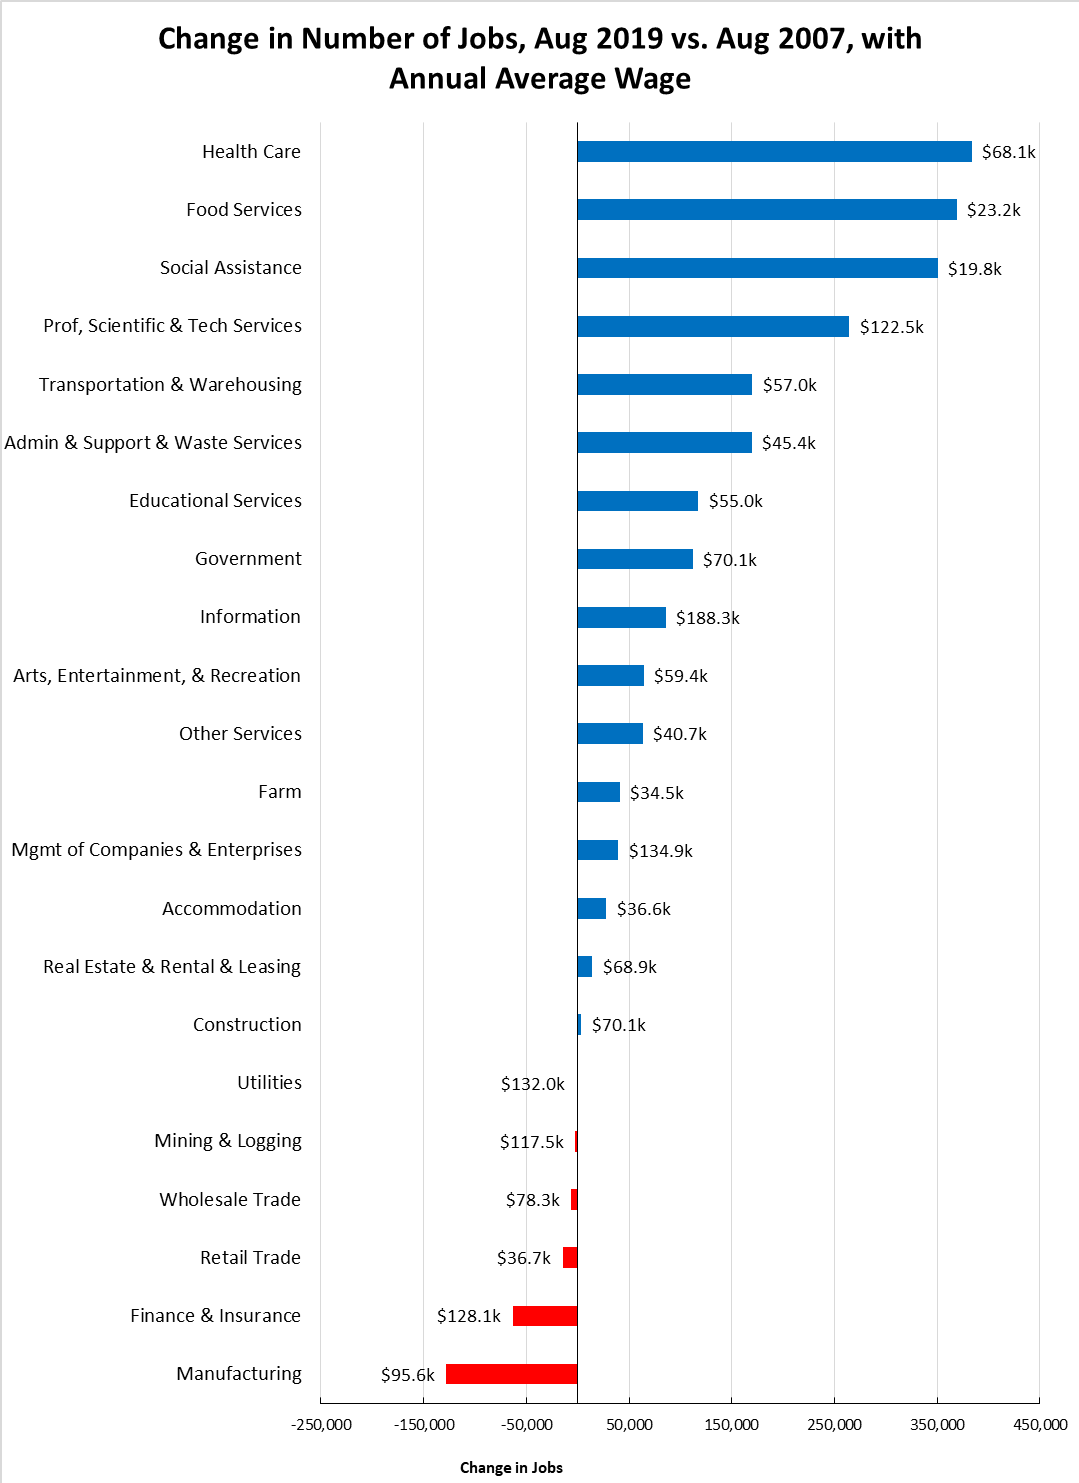
Figure Source: California Employment Development Department
Unemployment Rates by Region
| wdt_ID | Region | Unemployment Rates |
|---|---|---|
| 1 | California | 4.2 |
| 2 | Bay Area | 2.8 |
| 3 | Orange County | 3.0 |
| 4 | Sacramento | 3.7 |
| 5 | Central Sierra | 3.8 |
| 6 | Central Coast | 3.9 |
| 7 | San Diego/Imperial | 4.2 |
| 8 | Inland Empire | 4.4 |
| 9 | Los Angeles | 4.6 |
| 10 | Upstate California | 4.9 |
| 11 | Central Valley | 6.9 |
Figure Source: California Employment Development Department
Unemployment Rates by Legislative District
Lowest
| wdt_ID | Congressional District | Unemployment Rate |
|---|---|---|
| 1 | CD12 (Pelosi-D) | 2.1 |
| 2 | CD18 (Eshoo-D) | 2.2 |
| 3 | CD14 (Speier-D) | 2.4 |
| 4 | CD17 (Khanna-D) | 2.5 |
| 5 | CD15 (Swalwell-D) | 2.6 |
| 6 | CD52 (Peters-D) | 2.6 |
| 7 | CD49 (Levin-D) | 2.6 |
| 8 | CD45 (Porter-D) | 2.7 |
| 9 | CD48 (Rouda-D) | 2.8 |
| 10 | CD02 (Huffman-D) | 2.9 |
| wdt_ID | Senate District | Unemployment Rate |
|---|---|---|
| 1 | SD13 (Hill-D) | 2.1 |
| 2 | SD11 (Wiener-D) | 2.3 |
| 3 | SD36 (Bates-R) | 2.7 |
| 4 | SD37 (Moorlach-R) | 2.7 |
| 5 | SD39 (Atkins-D) | 2.7 |
| 6 | SD10 (Wieckowski-D) | 2.7 |
| 7 | SD15 (Beall-D) | 2.9 |
| 8 | SD07 (Glazer-D) | 2.9 |
| 9 | SD02 (McGuire-D) | 3.1 |
| 10 | SD38 (Jones-R) | 3.2 |
| wdt_ID | Assembly District | Unemployment Rate |
|---|---|---|
| 1 | AD22 (Mullin-D) | 2.0 |
| 2 | AD16 (Bauer-Kahan-D) | 2.0 |
| 3 | AD24 (Berman-D) | 2.2 |
| 4 | AD17 (Chiu-D) | 2.2 |
| 5 | AD28 (Low-D) | 2.3 |
| 6 | AD19 (Ting-D) | 2.4 |
| 7 | AD25 (Chu-D) | 2.5 |
| 8 | AD78 (Gloria-D) | 2.6 |
| 9 | AD73 (Brough-R) | 2.6 |
| 10 | AD10 (Levine-D) | 2.6 |
Highest
| wdt_ID | Congressional District | Unemployment Rate |
|---|---|---|
| 1 | CD51 (Vargas-D) | 9.2 |
| 2 | CD21 (Cox-D) | 8.5 |
| 3 | CD16 (Costa-D) | 7.6 |
| 4 | CD23 (McCarthy-R) | 6.7 |
| 5 | CD22 (Nunes-R) | 6.6 |
| 6 | CD44 (Barragan-D) | 6.4 |
| 7 | CD40 (Roybal-Allard-D) | 5.5 |
| 8 | CD10 (Harder-D) | 5.4 |
| 9 | CD09 (McNerney-D) | 5.4 |
| 10 | CD43 (Waters-D) | 5.4 |
| wdt_ID | Senate District | Unemployment Rate |
|---|---|---|
| 1 | SD21 (Wilk-R) | 5.2 |
| 2 | SD08 (Borgeas-R) | 5.2 |
| 3 | SD32 (Archuleta-D) | 5.3 |
| 4 | SD30 (Mitchell-D) | 5.6 |
| 5 | SD35 (Bradford-D) | 5.8 |
| 6 | SD05 (Galgiani-D) | 5.6 |
| 7 | SD12 (Caballero-D) | 6.1 |
| 8 | SD16 (Grove-R) | 6.4 |
| 9 | SD40 (Hueso-D) | 7.8 |
| 10 | SD14 (Hurtado-D) | 9.5 |
| wdt_ID | Assembly District | Unemployment Rate |
|---|---|---|
| 1 | AD56 (Garcia-D) | 11.1 |
| 2 | AD26 (Mathis-R) | 9.0 |
| 3 | AD32 (Salas-D) | 8.7 |
| 4 | AD31 (Arambula-D) | 7.9 |
| 5 | AD21 (Gray-D) | 7.1 |
| 6 | AD64 (Gipson-D) | 6.5 |
| 7 | AD13 (Eggman-D) | 6.3 |
| 8 | AD59 (Jones-Sawyer-D) | 6.3 |
| 9 | AD34 (Fong-R) | 6.0 |
| 10 | AD36 (Lackey-R) | 5.9 |
Employment Growth by Region
Containing 19.5% of the state’s population, the Bay Area has accounted for 41.5% of net employment growth compared to pre-recession levels. Los Angeles Region, with 29.0% of the population, accounted for only 15.7% of net employment gains, while Inland Empire continues to rank the second highest.
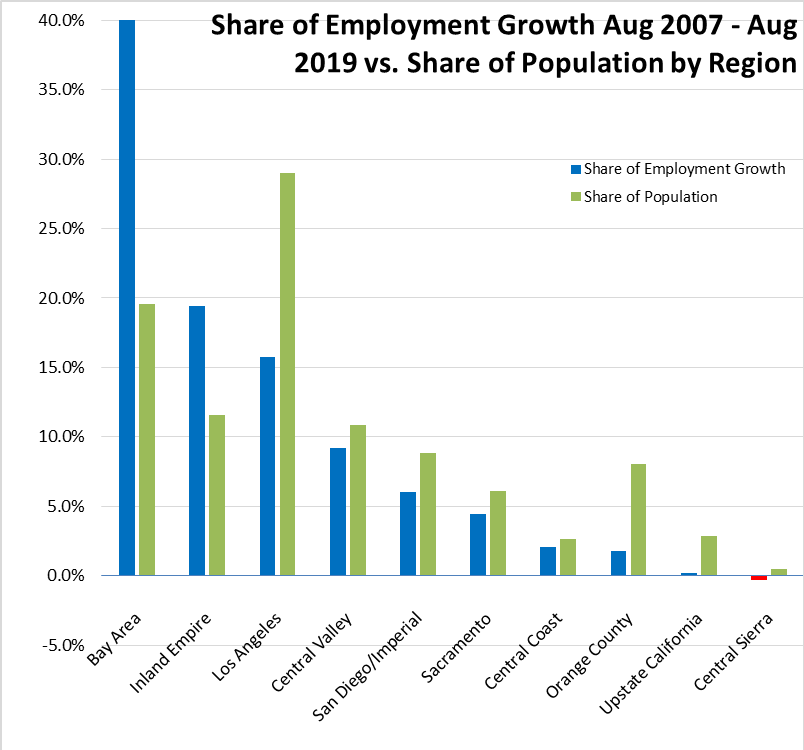
Figure Sources: California Employment Development Department; Department of Finance
MSAs with the Worst Unemployment Rates
Of the 20 Metropolitan Statistical Areas (MSAs) with the worst unemployment rates in July 2018, 10 are in California, including El Centro MSA (Imperial County) with the second highest unemployment rate in the country and Visalia-Porterville MSA with the third worst.
| wdt_ID | MSA | Unemp. | Rank (out of 389) |
|---|---|---|---|
| 1 | El Centro MSA | 20.7 | 388 |
| 2 | Visalia-Porterville MSA | 10.0 | 387 |
| 3 | Bakersfield MSA | 8.4 | 385 |
| 4 | Merced MSA | 8.4 | 385 |
| 5 | Hanford-Corcoran MSA | 7.8 | 384 |
| 6 | Madera MSA | 7.4 | 383 |
| 7 | Fresno MSA | 7.3 | 382 |
| 8 | Yuba City MSA | 6.7 | 379 |
| 9 | Modesto MSA | 6.6 | 376 |
| 10 | Stockton-Lodi MSA | 6.3 | 371 |
Figure Source: US Bureau of Labor Statistics, July 2018 data
Chart of the Month: Jobs & Wage Growth by Region
The employment growth by region shown above and in these monthly reports describes the individual side of the economy—where more people are finding work and doing this by showing the data in net growth terms. Where the greatest employment growth has occurred by comparing current levels to those in 2007 before the Great Recession.
The recent release of the revised 2018 Quarterly Census of Employment & Earnings allows the flip side of this equation to be shown—which regions have been creating the most jobs to employ them and at what wage levels.
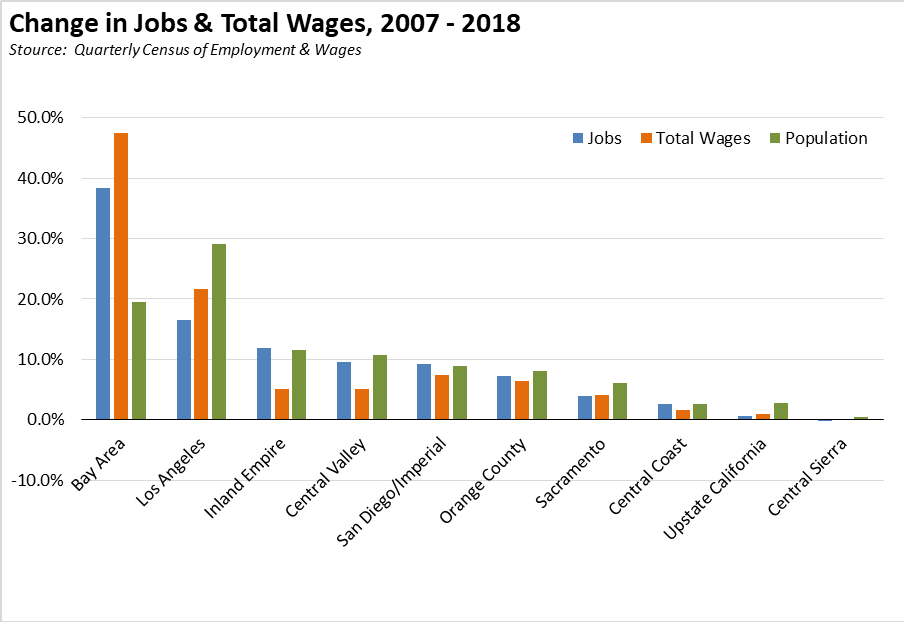
Not surprisingly, the data shows similar results—workers go to where the jobs are.
Comparing total covered jobs in 2007 and 2018, the greatest net jobs growth was in the Bay Area, accounting for 38.4% of all net jobs created while having only 19.6% of the state’s population. Los Angeles was in second place with 16.5% of net jobs, but well below their population share of 29.1%. Inland Empire and San Diego/Imperial are the only regions other than the Bay Area showing a net jobs share above their population share.
The distribution of wage growth was even more skewed. The Bay Area accounted for 47.5%, nearly half, of the growth in total wages and salaries paid, reflecting the jobs growth in this region primarily coming from the much higher pay tech industries. Los Angeles did better on this score, bringing in 21.6% of total wage and salary growth, reflecting the number of new jobs in some higher pay industries. Sacramento also did somewhat better, reflecting increasing pay for government workers.