Highlights for policy makers:
- Unemployment Rate Up Slightly to 5.8%; Total Employment Little Changed at -9,800
- Labor Force Participation Rate Unchanged
- Nonfarm Jobs Increase 60,400
- Six Industries Below 2007 Pre-Recession Job Levels
- 12 Counties in Double-Digit Unemployment; 12 are 5% or Less
- Two-Tier Economy Persists
- Bay Area Continues to Dominate Employment Growth
- Number of Latino and Asian Employers Increased by About One-Third from 2002
- Data revisions
Unemployment Rate Up Slightly to 5.8%; Total Employment Little Changed at -9,800
The Labor Force data for December 2015 (seasonally adjusted; California preliminary) is shown below, along with the change from the prior month:
| Seasonally Adjusted | California | US | ||
|---|---|---|---|---|
| Dec 2015 | Change from Nov 2015 | Dec 2015 | Change from Nov 2015 | |
| Unemployment Rate | 5.8 | 0.1 | 5.0 | 0.0 |
| Labor Force | 18,996,500 | 0.0% | 157,833,000 | 0.3% |
| Participation Rate | 62.0 | 0.0 | 62.6 | 0.1 |
| Employment | 17,900,400 | -0.1% | 149,929,000 | 0.3% |
| Unemployment | 1,096,100 | 1.3% | 7,904,000 | -0.3% |
The related not seasonally adjusted numbers (California preliminary), with the change from December 2014:
| Not Seasonally Adjusted | California | US | ||
|---|---|---|---|---|
| Dec 2015 | Change from Dec 2014 | Dec 2015 | Change from Dec 2014 | |
| Unemployment Rate | 5.8 | -1.0 | 4.8 | -0.6 |
| Labor Force | 18,934,500 | 0.4% | 157,245,000 | 1.1% |
| Participation Rate | 61.8 | -0.4 | 62.4 | -0.1 |
| Employment | 17,842,900 | 1.5% | 149,703,000 | 1.7% |
| Unemployment | 1,091,600 | -14.6% | 7,542,000 | -9.5% |
California Employment Development Department’s (EDD) latest release shows on a seasonally adjusted basis, total employment dipped by 9,800 from November, while the number of unemployed rose by 13,900. California’s seasonally adjusted unemployment rate notched up from 5.7% in November to 5.8% in December. The unadjusted rate decreased from 6.8% in December 2014 to 5.8% in December 2015.
Total US employment saw a seasonally adjusted increase of 485,000, while the number of unemployed decreased marginally by 20,000.
California’s seasonally adjusted unemployment rate was 16.0% higher than the national rate. California dropped one slot to have the 10th worst unemployment rate among the states (including DC).
Labor Force Participation Rate Unchanged
California’s seasonally adjusted labor force participation rate remained at post-1976 low of 62.0%.
Nonfarm Jobs Increase 60,400
EDD reported that between November and December 2015, seasonally adjusted nonfarm payroll jobs increased by 60,400. The November job gains were revised upwards slightly to 7,200 from the preliminary estimate of 5,500.
Looking at the not seasonally adjusted numbers, the change in total payroll jobs from November 2015 saw the largest increases in Retail Trade (20,700) due to the holiday season, Transportation, Warehousing & Utilities (7,500), Healthcare & Social Assistance (7,400), and Arts, Entertainment & Recreation (6,700). Biggest declines were in Farm (-46,700), Government (-11,000), and Educational Services (-7,000).
| Not Seasonally Adjusted Payroll Jobs | Nov 2015 | Dec 2015 | Change Dec 2015 – Nov 2015 | Change Dec 2015 – Dec 2014 |
|---|---|---|---|---|
| Total Farm | 406,400 | 359,700 | -46,700 | 4,300 |
| Mining & Logging | 28,500 | 27,800 | -700 | -3,000 |
| Construction | 745,500 | 740,900 | -4,600 | 59,100 |
| Manufacturing | 1,264,300 | 1,262,300 | -2,000 | -2,300 |
| Wholesale Trade | 746,200 | 747,200 | 1,000 | 16,500 |
| Retail Trade | 1,756,600 | 1,777,300 | 20,700 | 45,600 |
| Transportation, Warehousing & Utilities | 553,000 | 560,500 | 7,500 | 11,500 |
| Information | 478,400 | 483,000 | 4,600 | 15,300 |
| Finance & Insurance | 518,700 | 523,300 | 4,600 | -500 |
| Real Estate & Rental & Leasing | 273,900 | 275,000 | 1,100 | 4,800 |
| Professional, Scientific & Technical Services | 1,283,700 | 1,291,000 | 7,300 | 66,300 |
| Management of Companies & Enterprises | 233,400 | 233,300 | -100 | 5,000 |
| Administrative & Support & Waste Services | 1,100,800 | 1,104,400 | 3,600 | 53,800 |
| Educational Services | 383,600 | 376,600 | -7,000 | 9,400 |
| Health Care & Social Assistance | 2,154,400 | 2,161,800 | 7,400 | 63,200 |
| Individual & Family Services | 584,200 | 588,300 | 4,100 | 7,800 |
| Arts, Entertainment, & Recreation | 284,200 | 290,900 | 6,700 | 14,300 |
| Accommodation & Food Service | 1,561,700 | 1,562,800 | 1,100 | 62,500 |
| Other Services | 552,400 | 551,300 | -1,100 | 6,500 |
| Government | 2,500,200 | 2,489,100 | -11,100 | 36,200 |
| Total Nonfarm | 16,419,500 | 16,458,500 | 39,000 | 464,200 |
| Total Wage & Salary | 16,825,900 | 16,818,200 | -7,700 | 468,500 |
Six Industries Below 2007 Pre-Recession Job Levels
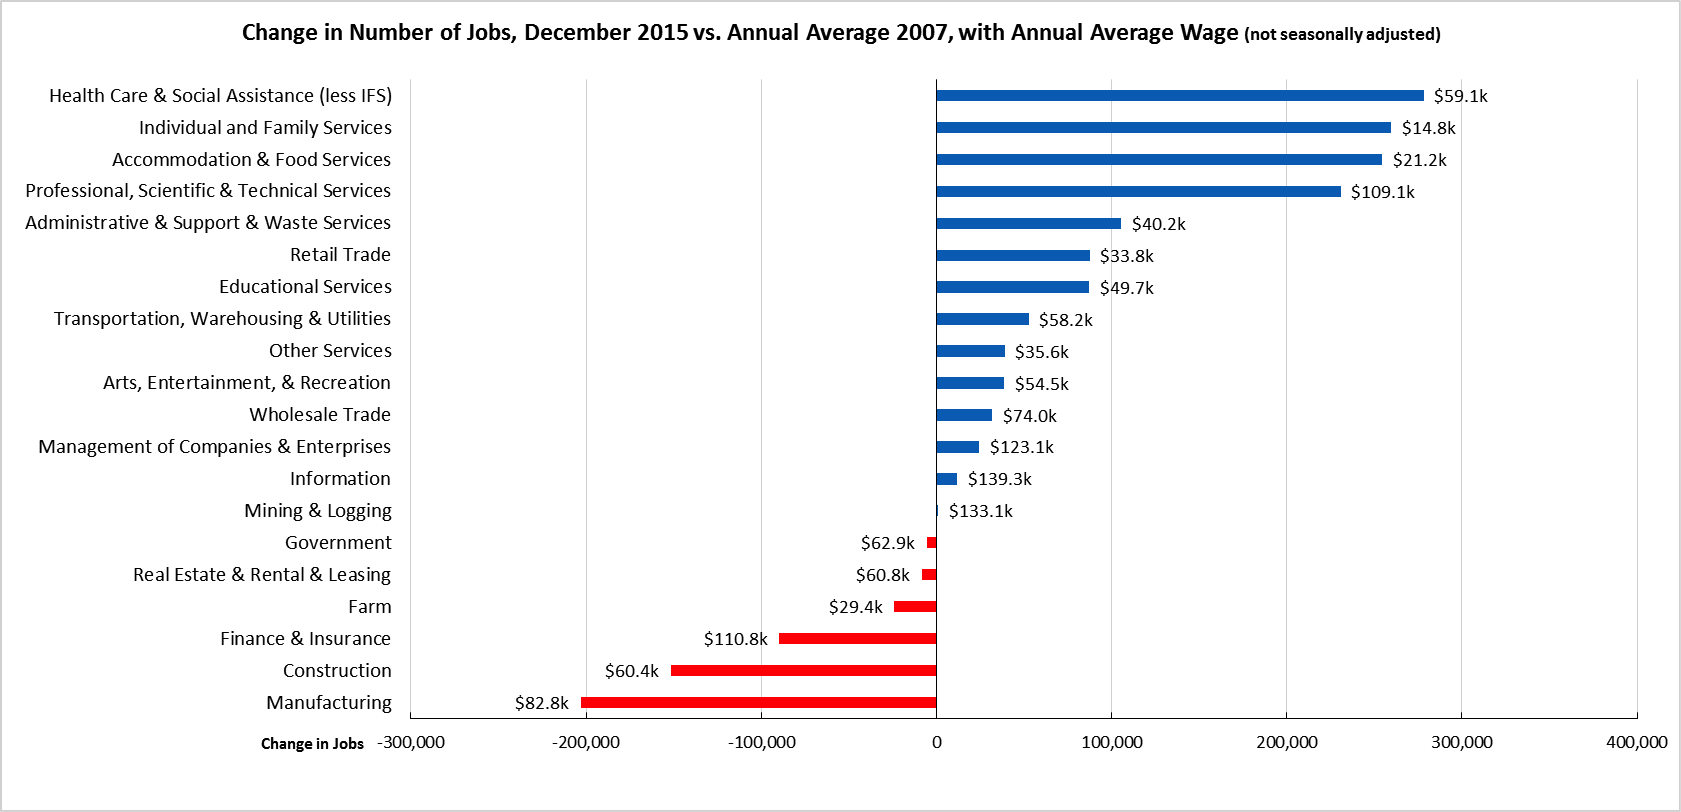
Comparing the number of jobs by industry in December 2015 (not seasonally adjusted), the number of industries remaining below the 2007 pre-recession levels returned to six as seasonal employment in Government and Farm dipped down. The dominant four growth industries continue to be divided between two higher wage industries (Health Care & Social Assistance (less Individual & Family Services), Professional, Scientific & Technical Services) and the two lowest wage industries (Individual & Family Services, Accommodation & Food Service).
Twelve Counties in Double-Digit Unemployment, 12 are 5% or Less

Two-Tier Economy Persists
Unemployment rates (all data is not seasonally adjusted) continue to vary widely across the state, ranging from 4.0% in the Bay Area to more than double at 10.2% in the Central Valley.
| Not Seasonally Adjusted | Unemployment Rate (%) December 2015 |
|---|---|
| California | 5.8 |
| Bay Area | 4.0 |
| Orange County | 4.1 |
| San Diego/Imperial | 5.5 |
| Sacramento Region | 5.5 |
| Los Angeles | 5.8 |
| Inland Empire | 5.9 |
| Central Sierra | 6.5 |
| Upstate California | 8.0 |
| Central Coast | 8.1 |
| Central Valley | 10.2 |
Ratio of Highest to Lowest Rate: 2.58
By County:
| Lowest 3 Unemployment Rates | |
|---|---|
| San Mateo County | 3.1 |
| Marin County | 3.2 |
| San Francisco County | 3.3 |
| Highest 3 Unemployment Rates | |
|---|---|
| Tulare County | 12.2 |
| Colusa County | 19.3 |
| Imperial County | 19.6 |
Ratio of Highest to Lowest Rate: 6.32
By Legislative District:
| Lowest 10 Unemployment Rates | |||
|---|---|---|---|
| SD 13 (Hill – D) | 2.9 | AD 22 (Mullin – D) | 2.8 |
| SD 11 (Leno – D) | 3.4 | AD 16 (Baker – R) | 2.9 |
| SD 37 (Moorlach – R) | 3.5 | AD 24 (Gordon – D) | 3.0 |
| SD 39 (Block – D) | 3.8 | AD 28 (Low – D) | 3.1 |
| SD 36 (Bates – R) | 3.9 | AD 17 (Chiu – D) | 3.3 |
| SD 15 (Beall – D) | 3.9 | AD 19 (Ting – D) | 3.4 |
| SD 07 (Glazer – D) | 4.1 | AD 77 (Maienschein – R) | 3.4 |
| SD 10 (Wieckowski – D) | 4.1 | AD 74 (Harper – R) | 3.4 |
| SD 26 (Allen – D) | 4.3 | AD 73 (Brough – R) | 3.5 |
| SD 29 (Huff – R) | 4.5 | AD 25 (Chu – D) | 3.5 |
| Highest 10 Unemployment Rates | |||
|---|---|---|---|
| SD 24 (de León – D) | 6.8 | AD 64 (Gipson – D) | 8.4 |
| SD 33 (Lara – D) | 6.8 | AD 03 (Gallagher – R) | 8.7 |
| SD 35 (Hall – D) | 7.0 | AD 30 (Alejo – D) | 8.8 |
| SD 04 (Nielsen – R) | 7.1 | AD 23 (Patterson – R) | 9.2 |
| SD 05 (Galgiani – D) | 8.6 | AD 13 (Eggman – D) | 9.4 |
| SD 08 (Berryhill – R) | 8.7 | AD 21 (Gray – D) | 11.5 |
| SD 16 (Fuller – R) | 8.9 | AD 31 (Vacant – D) | 11.7 |
| SD 40 (Hueso – D) | 9.0 | AD 26 (Mathis – R) | 11.9 |
| SD 12 (Cannella – R) | 10.8 | AD 56 (Garcia – D) | 12.0 |
| SD 14 (Vidak – R) | 13.1 | AD 32 (Salas – D) | 12.5 |
Ratio of Highest to Lowest Rate: Senate 4.51
Ratio of Highest to Lowest Rate: Assembly 4.40
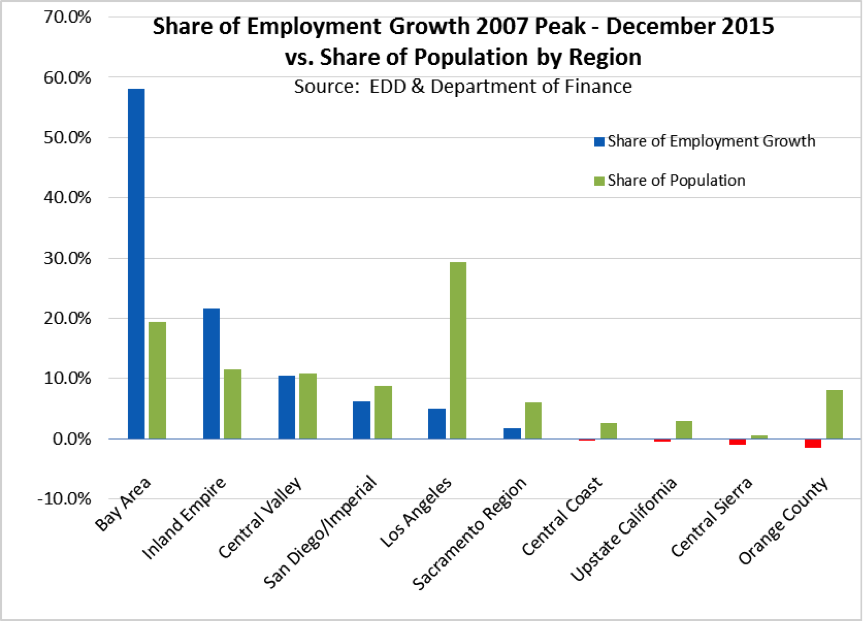
Bay Area Continues to Dominate Employment Growth
Bay Area continues to dominate employment growth in the state, capturing 58.2% of the state’s net employment growth since the 2007 pre-recession peak (December 2007), while containing only 19.4% of the state population. Inland Empire continues to show employment growth larger relative to their share of the population. Los Angeles Region with 29.4% of the population, contains only 5.0% of the state’s net employment growth since the pre-recession peak.
Number of Latino and Asian Employers Increased by About One-Third from 2002
In December, the Census Bureau released the results of the 2012 Survey of Business Owners. This Survey is the only data source providing demographic information on business owners (defined as identifiable persons with a majority ownership share in a business) at the state, county, and city level.
The data is summarized below for the largest demographic groups. In general:
- The number of both Latino and Asian/Pacific Islander Firms with Employees increased by about 1/3 between 2002 and 2012. The number of employees in those firms increased by about 40% for both groups.
- The number of Black Firms with Employees decreased slightly in this period, but the number of employees in those firm also increased 40% over the 10-year period.
- Both the number of White Firms and the number of employees in those firms decreased in this period. Adjusting for the differing treatment of the “Other Race” responses between the 2007 and 2012 Surveys, this demographic group saw a net drop of about 20,000 firms and loss of over 800,000 employees.
Growth in the number of Firms without Employees—both the self-employed and firms with nonpaid family workers—was even more dramatic. Reflecting the overall trend in the state of more persons seeking employment as proprietors rather than traditional wage and salary jobs, all the demographic groups shown except for Whites showed significantly larger growth rates, nearly doubling in the case of Latinos.
| 2002 | 2007 | 2012 | Change | ||
|---|---|---|---|---|---|
| Firms with Employees | |||||
| Firms | Latino | 47,566 | 57,583 | 64,463 | 35.5% |
| White | 511,009 | 495,658 | 469,114 | -8.2% | |
| Asian/PI | 103,654 | 118,940 | 135,772 | 31.0% | |
| Other | n/a | 2,151 | 23,468 | ||
| Black | 9,991 | 9,684 | 9,572 | -4.2% | |
| Employees | Latino | 445,820 | 458,922 | 517,054 | 16.0% |
| White | 6,102,857 | 5,774,665 | 5,134,422 | -15.9% | |
| Asian/PI | 752,547 | 911,944 | 1,026,324 | 36.4% | |
| Other | n/a | 16,377 | 164,953 | ||
| Black | 67,179 | 85,263 | 94,201 | 40.2% | |
| Firms without Employees | Latino | 380,112 | 508,990 | 750,841 | 97.5% |
| White | 1,811,112 | 2,123,511 | 1,874,325 | 3.5% | |
| Asian/PI | 274,950 | 399,203 | 483,544 | 75.9% | |
| Other | n/a | 14,615 | 362,756 | ||
| Black | 102,824 | 128,207 | 167,730 | 63.1% |
Additional information from the Survey will be provided in a summary paper to be posted on the Center’s website.
Data Revisions
Labor force (2010-2015) and employment (2014-2015) data revisions will be released by BLS and EDD over the coming months, with the final revisions currently scheduled for April 15. The Center’s data series will be updated accordingly, although full comparability will not be re-established until the final updates are released in April. In addition, the various legislative district estimates have been updated in accordance with the 2010-2015 American Community Survey data. These preliminary revisions will be further updated as the BLS/EDD data is released.
Due to the BLS/EDD updates, there will be no state labor force data released in February, and consequently no Jobs Report in that month. Instead, the January data is scheduled for March 4 and the February data on March 18. The corresponding Jobs Reports will be released the following Monday in each case.
Note: All data sources, methodologies, and historical data series available at CenterforJobs.org.