Highlights for policy makers:
- COVID-19 and the State Economy
- CaliFormer Businesses: Update
- Nonfarm Jobs: 769k Below Pre-Covid Level
- Jobs Change by Industry
- Employment 751k Below Pre-Covid Level
- Labor Force Participation Rate
- Employment Recovery by Region
- Unemployment Rates by Legislative Districts
- Unemployment Rates by Region
- MSAs with the Worst Unemployment Rates
- Technical Notes
COVID-19 and the State Economy
The overall results for December contained mixed results depending on the metric used to assess the current conditions of the state’s economic recovery. The rise in nonfarm jobs was the lowest since February, again suggesting—especially combined with the recent rise in unemployment insurance claims—a slowdown in the state’s recovery rate even prior to shifts occurring due to the Omicron variant. The rise in the number of employed, however, was the second highest, even bypassing the upswing seen in the revised November number. In all at the end of the year, California recovered 72% of the nonfarm jobs lost to the pandemic compared to 86% by the other states. Measured by employment, California showed 75% recovery compared to the other states at 91%.
The differences in the two series continue to reflect some structural issues such as workers starting their own businesses the rise of self-employment even in the face of the risks imposed under AB 5, as well as technical issues including misclassification errors in the household survey and low response rates in the establishment survey used to develop the job numbers. Additional clarification more so than in previous years is likely to come with the annual revisions that began with the US numbers this month and will finish with all geographic levels in March. The revisions this year will also incorporate additional analytical changes due to improvements to the models used by the agencies.
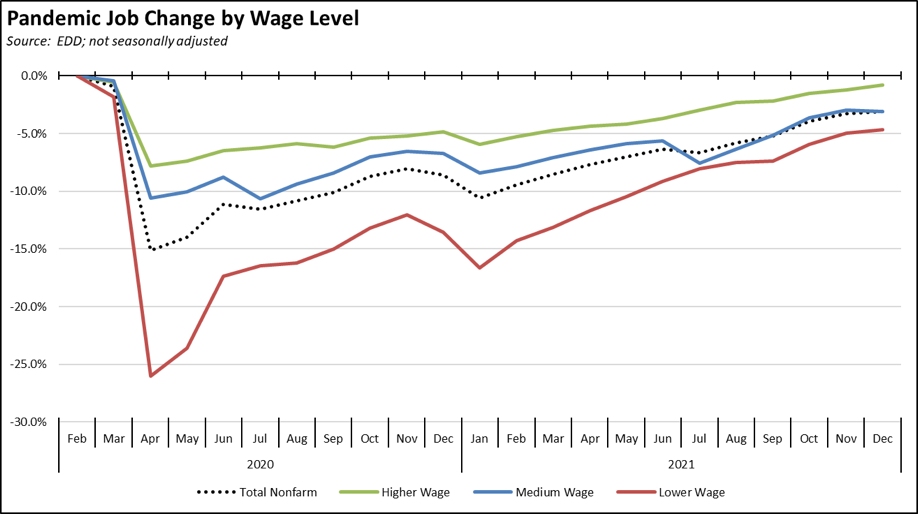
Using the more relevant unadjusted numbers, jobs by wage level also showed mixed results. Relative gains were strongest within the higher wage industries, which in absolute numbers nearly matched the rise in the lower wage industries. Medium wage industries lost ground, with continued gains in Transportation & Warehousing more than offset by dips in construction and government. The higher wage industries were less than a percent below the pre-pandemic level. Lower wage industries were still nearly 5% below.
In the chart, higher wage jobs are those industries with average annual wages above $100,000; medium wage is $50,000 to $100,000; and lower wage is below $50,000. Job data is drawn from the industry classifications, unadjusted job numbers, and wage levels generally used in the regular report section below on Nonfarm Jobs.
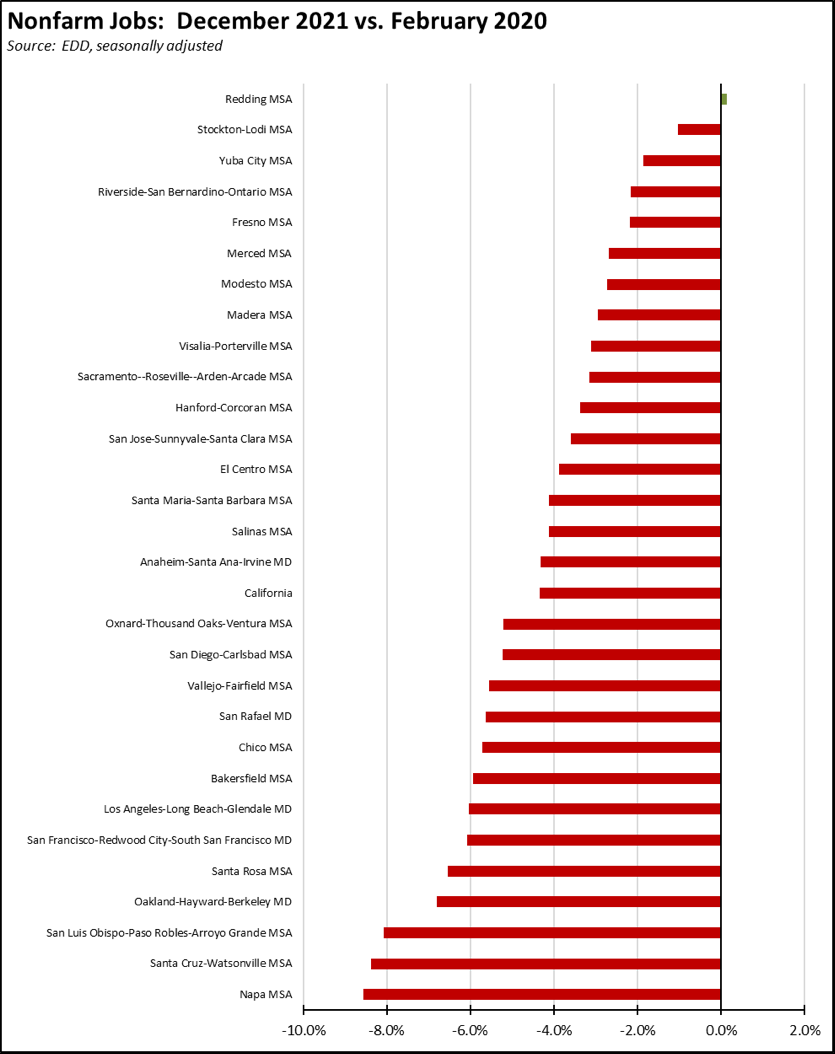
Recovery progress also varies widely across the state. Our initial analysis of the December numbers discussed the overall results in 2021 for the state. The chart below indicates progress in nonfarm wage and salary jobs recovery by MSA.
As indicated, nonfarm jobs remain below the pre-pandemic level in all urban areas within the state except for Redding MSA. The relative recovery rates, however, vary widely, with four MSAs in the Central Valley and Inland Empire near or below 2% shy of recovery, and another three MSAs at a greater than 8% gap.
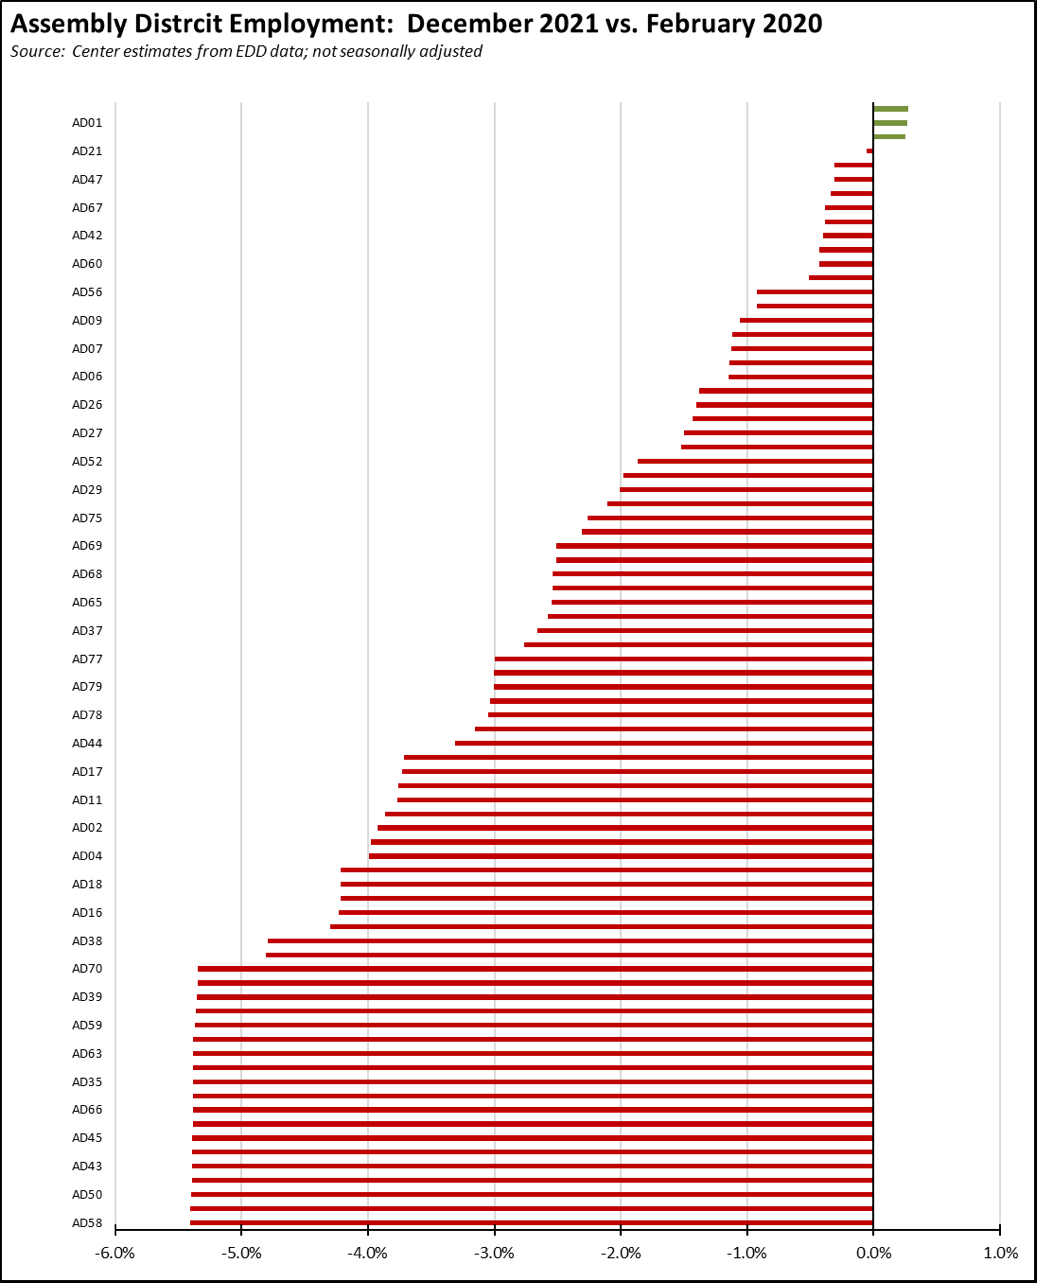
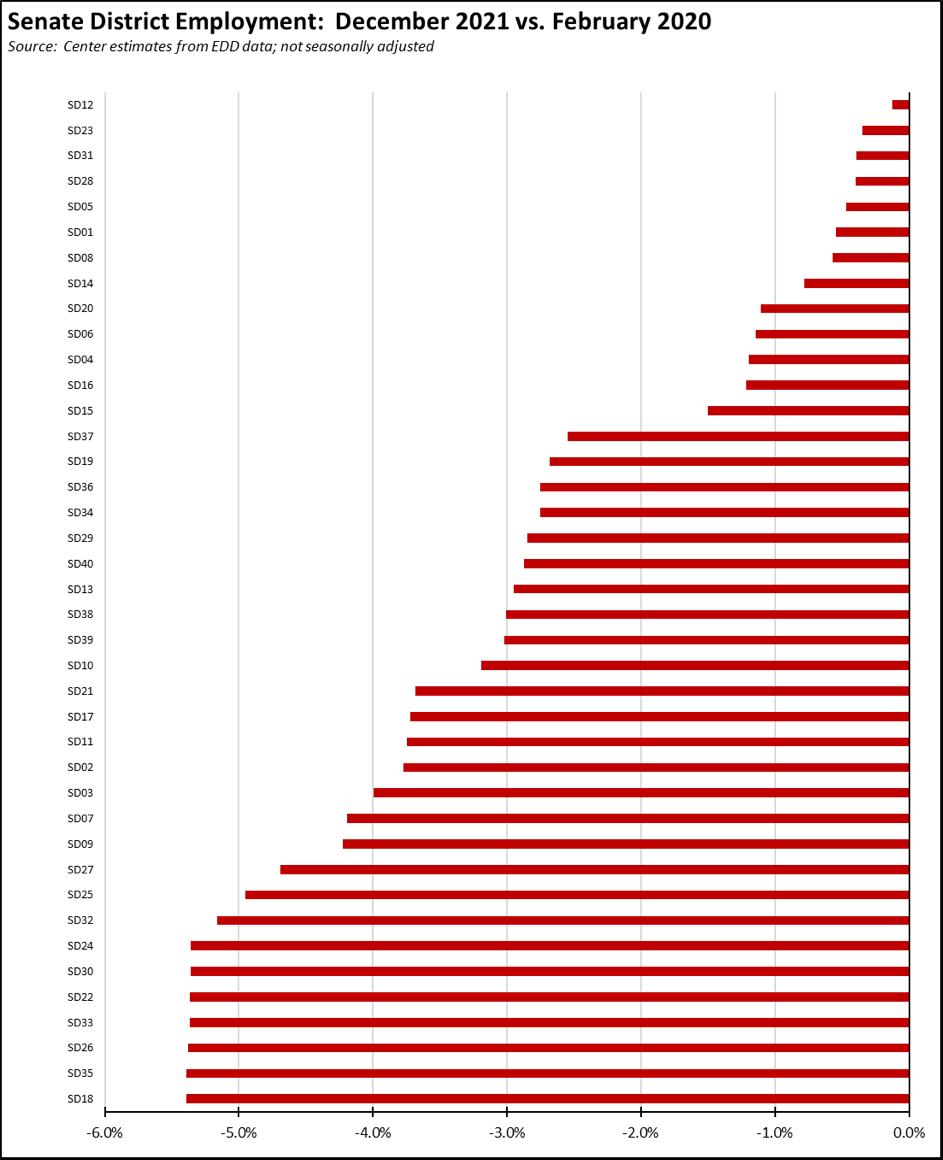
Using employment for the legislative districts, only three Assembly Districts were above their estimated pre-pandemic level, with another coming in just below the February 2020 number. Recovery levels using this goal post range from a 0.3% gain in the three districts, to a 5.4% gap in 17 districts. The Senate Districts, however, showed none in recovery, with remaining gaps ranging from -0.1% (essentially recovery) in SD 12 to a 5.4% gap in 7 districts.
In all cases—the state numbers as well as the subarea numbers above—“recovery” is measured only against the pre-pandemic point in February 2020. This comparison does not include additional growth over the past two years that was shut off by the state closures, which at that point in California and the rest of the country was running at elevated rates compared to the previous Great Depression recovery period.
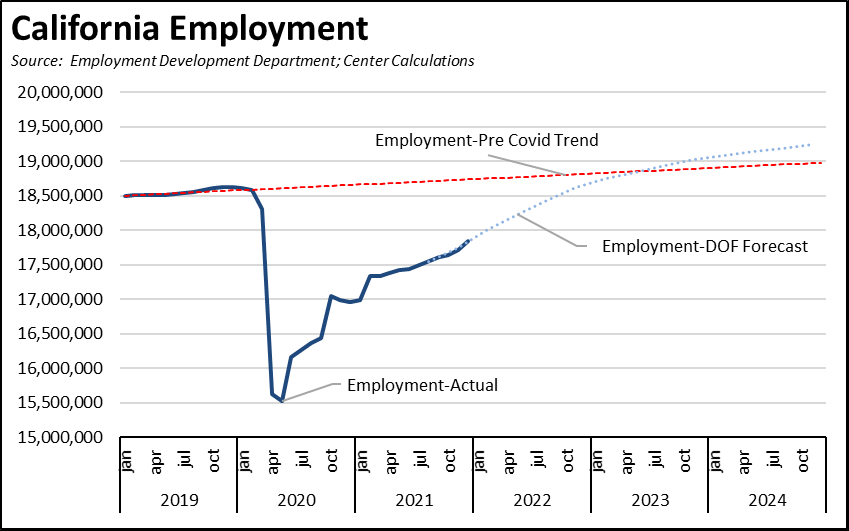
Using the employment numbers, the current Department of Finance economic projections expect recovery as defined by the pre-pandemic level to occur at the end of 2022, the same as they project for nonfarm jobs as well. Taking into account the growth that was shut off by the pandemic actions, full recovery as defined by return to trend would not occur until later in 2023. The Finance projections, however, were completed last November before factors such as additional disruptions coming from the Omicron variant, continuing supply chain issues, and continuing escalation in the inflation rate.
Another potential factor affecting California’s continued progress is the fact that California’s recovery continues to lag while much of the rest of the country has by some definitions reached full employment, both as defined by current unemployment rates and comparing the current rates to the natural (noncyclical) rate of unemployment. While California continues to focus on recovery, the nation as a whole will instead be turning to policy actions to deal with inflation which has the potential to raise further the cost of our recovery in addition to existing self-inflicted costs such as rising energy, tax and fee, labor, and other costs.
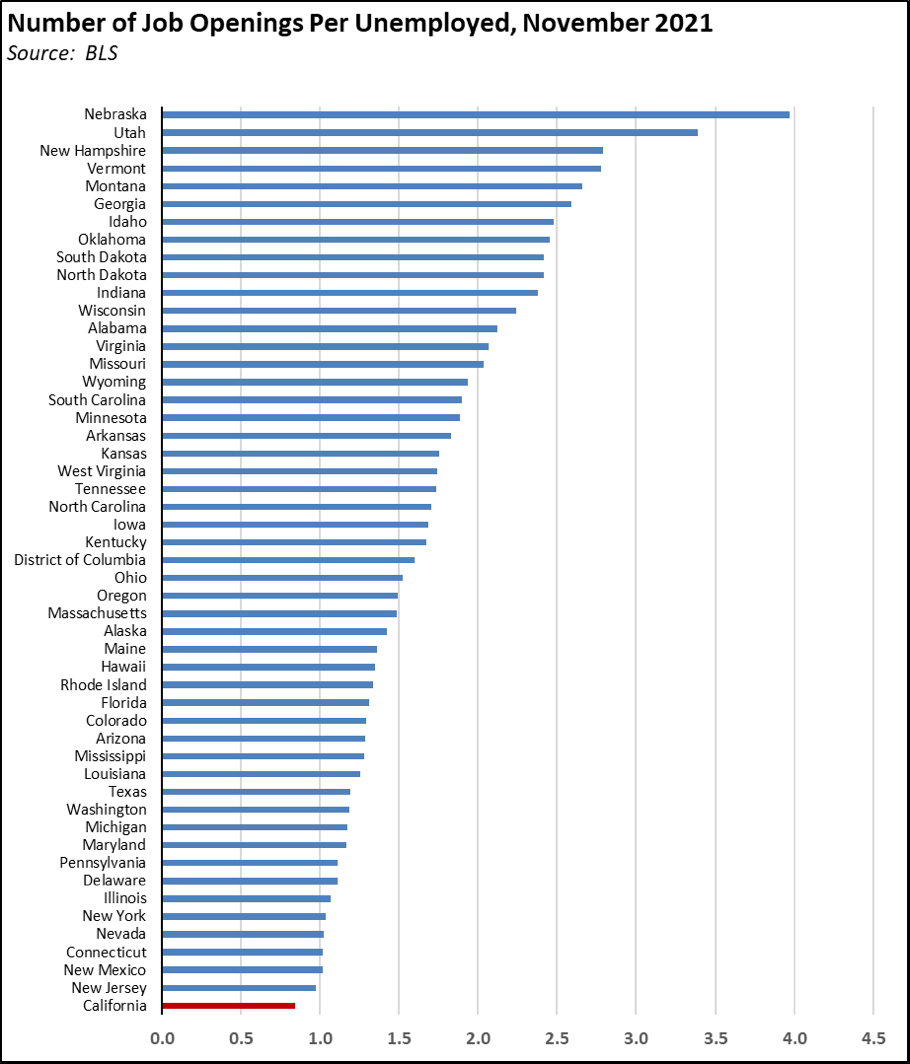
This comparative situation is again reflected in the Job Openings & Labor Turnover Survey (JOLTS) for the states. In the most recent numbers for November, labor shortages continue to be reflected in the elevated numbers of unfilled job openings, with California showing 1.118 million unfilled jobs. Collectively, these open slots represent the immediate expansion potential to accelerate recovery if there are enough workers and workers with the required skills.
Expressed as a ratio to the number of unemployed, however, California is the only state to fall below the ratio of 1.0, meaning that California is the only state where there are fewer job openings than people actively looking for work. Every other state is above 1.0, and the majority is above 1.5 up to states such as Utah and Nebraska where there are 3 to 4 times as many open jobs as unemployed workers to fill them.
The immediate challenge to continued recovery in California is to move the unemployed back to work, through skills improvements or other means. In other states, the challenge is as much getting workers to re-enter the labor force to expand the labor supply and for a majority of states, attracting workers to move there as well. Longer term, these numbers indicate California will need to accelerate its job creation if it is to make a dent in its broader unemployment and labor force participation issues. Other states have that job potential now; they just need the workers to fill it.
CaliFormer Businesses: Update
Additional CaliFormer companies identified since our last monthly report are shown below. Companies listed below include those that have announced: (1) moving their headquarters or full operations out of state, (2) moving business units out of state (generally back office operations where the employees do not have to be in a more costly California location to do their jobs), (3) California companies that expanded out of state, and (4) companies turning to permanent telework options, leaving it to their employees to decide where to work and live. The list is not exhaustive but is drawn from a monthly search of sources in key cities.
| wdt_ID | Companies | From | To | Reason | Source | Year |
|---|---|---|---|---|---|---|
| 167 | American Technology Network | South San Francisco | Florida | HQ & manufacturing move | Read More | 2022 |
| 168 | BNSF | Stockton | Phoenix | Intermodal logistics center expansion | Read More | 2022 |
| 169 | Intel | Santa Clara | Ohio | $20 billion chip fabrication plants | Read More | 2022 |
| 170 | Marrone Bio | Davis | North Carolina | HQ move | Read More | 2022 |
| 171 | Mrs. Grossman's Paper Company | Petaluma | Utah | HQ & manufacturing move | Read More | 2022 |
| 172 | Noodoe EV | Los Angeles | Houston | HQ move | Read More | 2022 |
| 173 | OnePointOne Inc. | San Jose | Phoenix | Expansion | Read More | 2021 |
| 174 | Review Wave | Irvine | Dallas | HQ move | Read More | 2022 |
| 175 | Rivian | Irvine | Georgia | $5 billion manufacturing plant | Read More | 2022 |
| 176 | Science 37 | Los Angeles | North Carolina | HQ move | Read More | 2021 |
| Companies | From | To | Reason | Source | Year |
Califormers: People Moving from the State
In addition to businesses, an increasing number of individuals and households have become Califormers as well, as they seek better paying jobs and lower costs in other states. Last month, we discussed the most recent estimates from the Department of Finance which reported the first ever annual decline in the July 1, 2021 population for California, with a loss of 173,000 (0.4%).
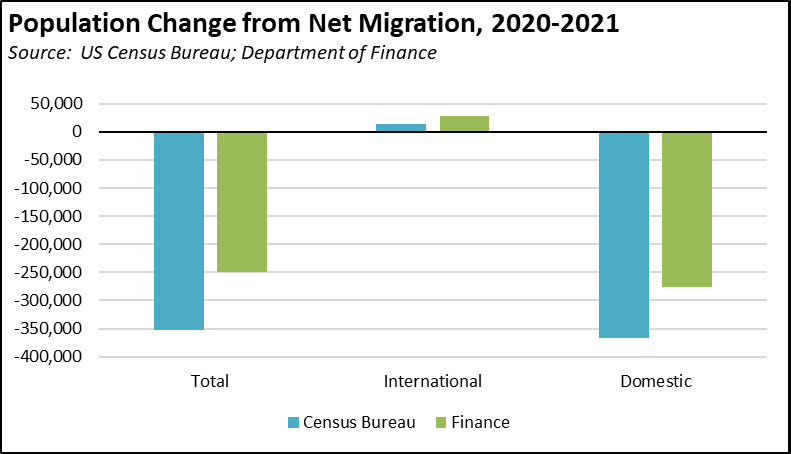
The US Census Bureau separately puts out their own estimates of state populations, and as in prior years, the numbers show some differences with those from Finance. The Census Bureau numbers show a larger drop of 261,902 (-0.7%) as of July 1, 2021. The numbers for 2020 also show an additional but minor drop of 12,485 from the previous estimates for 2019.
While estimates for natural increases (births and deaths) are close in both sources, the main differences arise over differing assumptions related to migration. The Census numbers indicate fewer migrants from other countries chose to seek economic opportunity in California (net international migration of 14,339) than in the Finance estimates (27,424). The differences in net domestic migration—the number moving to other states compared to the number moving in—was even larger, with the Census Bureau number at 367,299 vs. Finance at 276,663.
Nonfarm Jobs: 769k Below Pre-Covid Level
Nonfarm wage and salary jobs were up 50,700 (seasonally adjusted) in December, while gains in November were revised up 6,500 to 52,200.
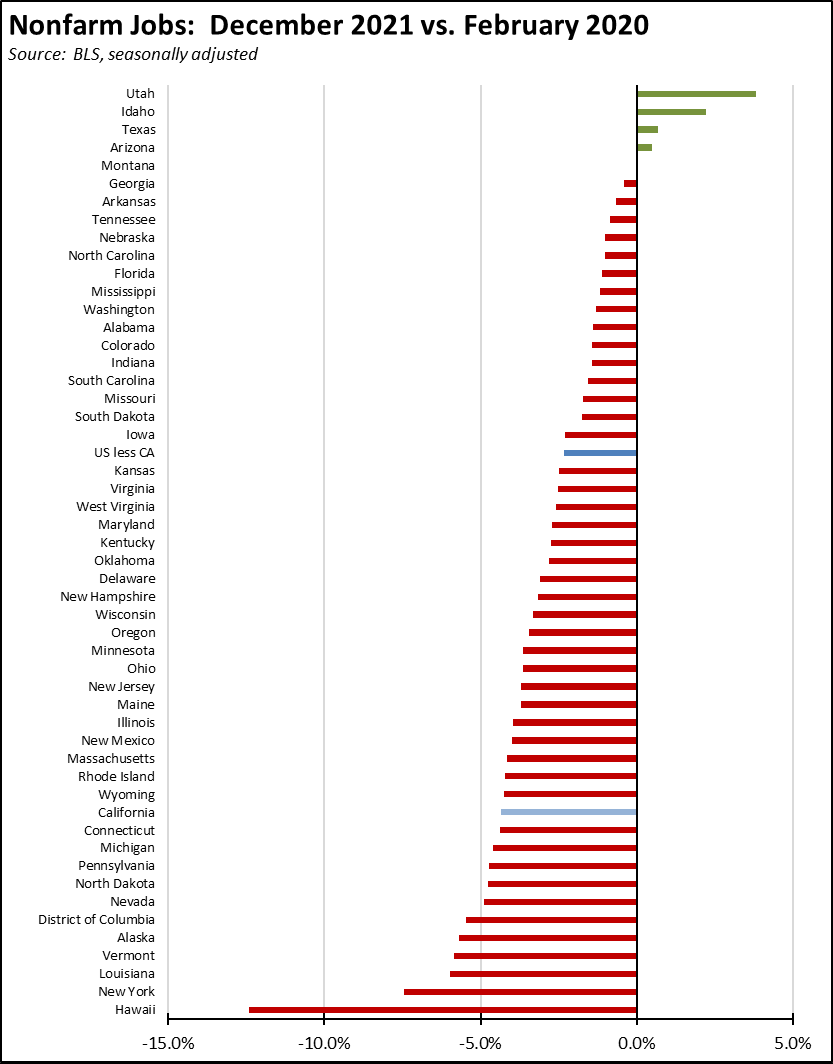
California showed the largest monthly increase but was followed closely by Texas at 50,000 and New York at 45,300. In fact, Texas has seen higher or equivalent job numbers in three of the past four months, rising 298,100 in total during this period compared to California at 269,800. Five states now meet or exceed their February 2020 jobs numbers, while California remained 768,600 behind, or 19.6% of the national shortfall.
California moved from 13th to 12th lowest rate of jobs recovery among the states.
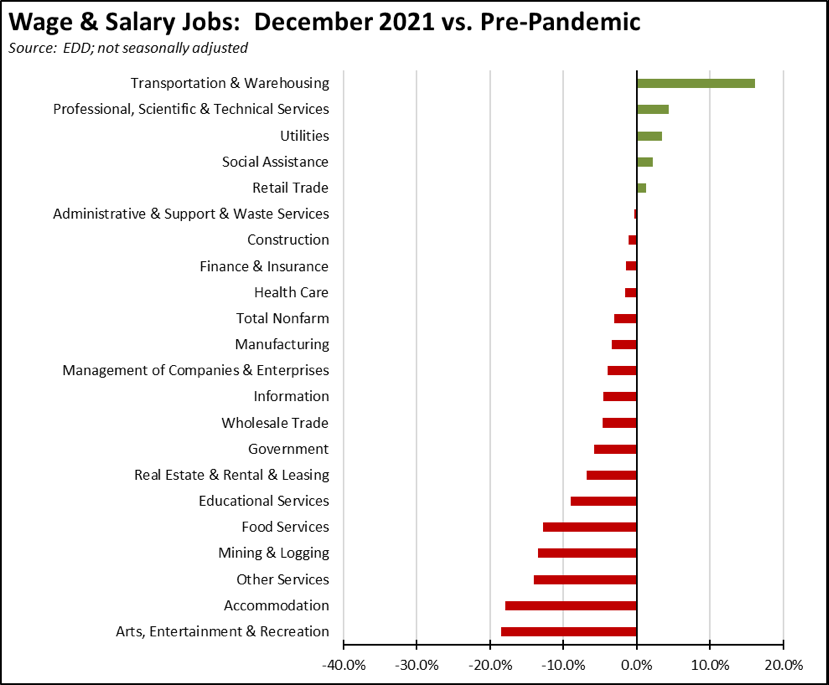
Jobs Change by Industry
Using the unadjusted numbers that allow a more detailed look at industry shifts, the number of industries showed job levels at or exceeding the pre-pandemic February 2020 levels dipped to 5. Transportation & Warehousing by a substantial margin shows the strongest growth as companies continue to battle the ongoing supply chain disruptions. The biggest lags in recovery continue to those lower-wage industries that were hardest hit by the state-ordered closures: Arts, Entertainment & Recreation, Accommodation, Other Services, and Food Services.
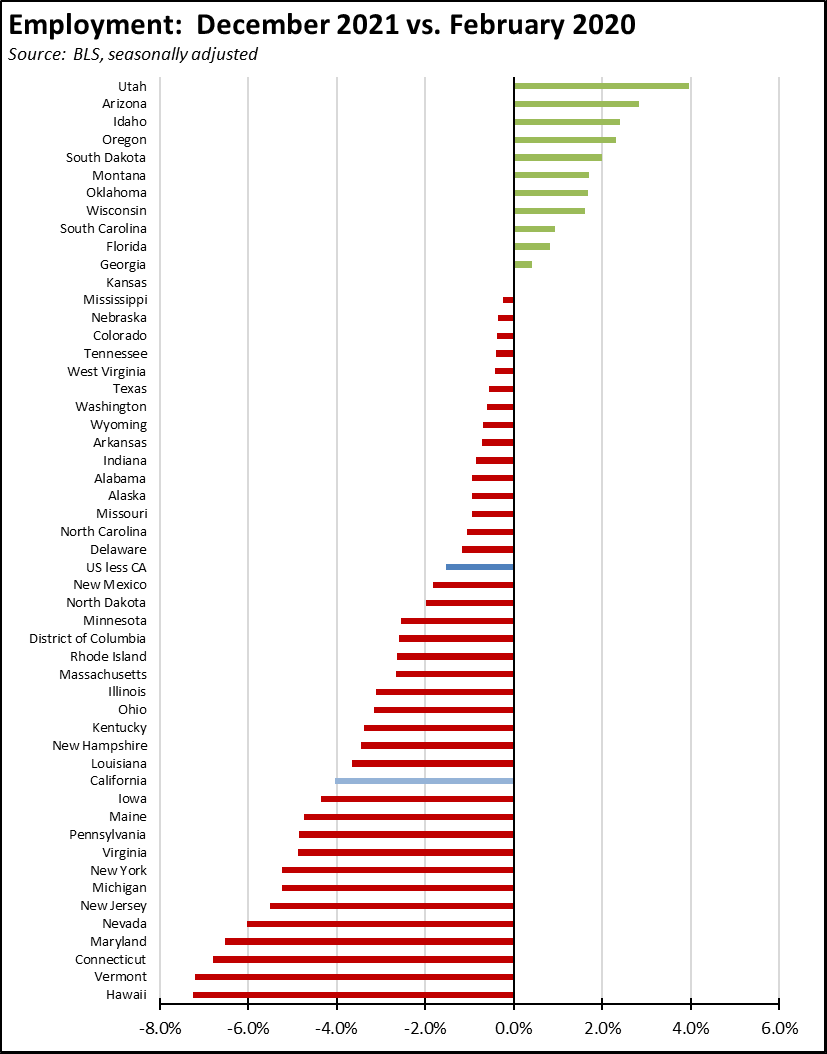
Employment 751k Below Pre-Covid Level
EDD reported that employment (seasonally adjusted; December preliminary) was up 116,900 from the revised November numbers, while the number of unemployed was down by 86,800. The employment numbers continue to be more variable than the job numbers, with continued corrections to be made in the annual revisions to be released in March.
The reported unemployment rate improved 0.5 point to 6.5% compared to 4.3% in February 2020 prior to the pandemic. California again had the highest unemployment rate among the states. California contained 19.6% of the total number of unemployed workers in the US.
In the national numbers, total US employment rose 651,000, and the number of unemployed dropped by 483,000. The reported unemployment rate improved 0.3 point to 3.9%, closing in on the 3.5% rate recorded in February 2020. The December release also included revisions to the national labor force data beginning with 2017.
Figure Sources: California Employment Development Department; US Bureau of Labor Statistics
In the seasonally adjusted numbers, California employment remains 750,900 (4.0%) below the pre-pandemic level in February 2020; the rest of the states combined were 1.5% below. California went from 12th to 13th lowest ranked by employment recovery level, while 12 states were above the pre-pandemic February 2020 employment levels.
Labor Force Participation Rate
The labor force participation rate edged up 0.1 point to 61.3%, while the US number was unchanged at 61.9%. The California rate remains well below the pre-pandemic level of 62.5%, which in turn was down substantially from prior years. Accounting for workers leaving the workforce since February 2020, there were 1.6 million out of work in December.
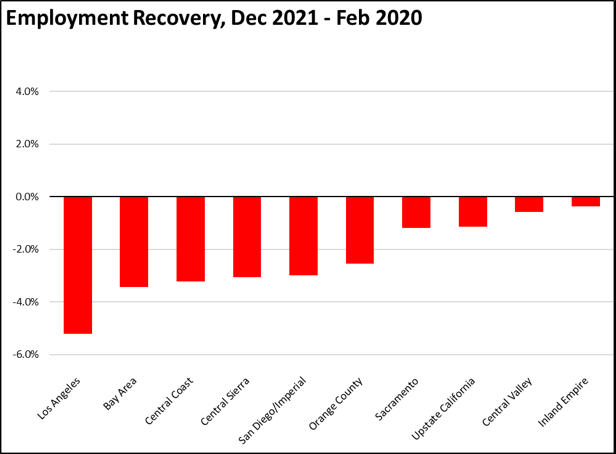
Employment Recovery by Region
Comparing December employment to pre-pandemic February 2020, Los Angeles Region lagged behind the rest of the state, showing a loss of 5.2% and containing 50% of the total employment shortfall in the state compared to 29% of the total population.
Unemployment Rates by Legislative Districts
The highest and lowest estimated unemployment rates in December are shown below.
Lowest
Highest
Unemployment Rates by Region
Unemployment rates (not seasonally adjusted) compared to pre-pandemic February 2020 show both Los Angeles and Sacramento regions below the pre-pandemic unemployment rates. Los Angeles, however, previously experienced a significantly higher unemployment rate than most of the other regions going into the pandemic period.
| wdt_ID | Region | December - 21 | February - 20 |
|---|---|---|---|
| 2 | California | 5.0 | 4.3 |
| 6 | Bay Area | 3.4 | 2.7 |
| 10 | Orange County | 3.7 | 7.0 |
| 14 | Sacramento | 4.4 | 4.5 |
| 18 | Central Sierra | 4.6 | 8.4 |
| 22 | San Diego/Imperial | 4.7 | 3.9 |
| 26 | Inland Empire | 5.1 | 3.7 |
| 30 | Upstate California | 5.4 | 2.8 |
| 34 | Central Coast | 5.7 | 4.6 |
| 38 | Los Angeles | 6.0 | 6.3 |
| 39 | Central Valley | 7.2 | 3.8 |
Figure Source: California Employment Development Department
MSAs with the Worst Unemployment Rates
California dipped to 10 of the MSAs among the 25 regions with the worst unemployment rates in November, including El Centro MSA (Imperial County) with the worst unemployment rate in the nation.
| wdt_ID | MSA | November Unemployment Rate | US Rank out of 389 |
|---|---|---|---|
| 1 | El Centro MSA | 15.5 | 389 |
| 2 | Visalia-Porterville MSA | 8.2 | 386 |
| 3 | Merced MSA | 7.6 | 383 |
| 4 | Bakersfield MSA | 7.4 | 381 |
| 5 | Hanford-Corcoran MSA | 7.3 | 380 |
| 6 | Fresno MSA | 7.0 | 378 |
| 7 | Madera MSA | 6.7 | 376 |
| 8 | Yuba City MSA | 6.6 | 372 |
| 9 | Stockton-Lodi MSA | 6.6 | 372 |
| 10 | Los Angeles-Long Beach-Anaheim MSA | 6.4 | 367 |
Technical Notes
The Center’s data will be updated over the next few months as the annual data revisions are completed by various agencies, in particular the labor force and jobs numbers by BLS and EDD.
In addition, the final approved maps by the 2020 California Citizens Redistricting Commission have been released. The Center for Jobs will be updating the California maps and data across the website in early 2022 to reflect the new legislative district boundaries. We will continue to cover data for the 2012 district boundaries throughout most of the year, but will begin to transition to the 2022 district data and estimates as this information is developed.