Highlights for policy makers:
- COVID-19 and the State Economy
- Jobs Recovery: California Still Lags US
- CaliFormer Businesses
- CaliFormers Update
- CaliFormer Indicators: WARN Act Notices
- CaliFormer People
- Nonfarm Jobs: 70,000 Above Pre-Covid Peak
- Jobs Change by Industry
- Employment 293,300 Below Pre-Covid Level
- Labor Force Participation Rate
- Unemployment Rates by Legislative District
- Unemployment Rates by Region
- Employment Recovery by Region
- MSAs with the Worst Unemployment Rates
COVID-19 and the State Economy
As discussed in our preliminary reports, the December data shows the same trend as in recent months. Nonfarm jobs at a gain of 16,200 remained positive but slowing. The employment numbers posted a loss for the fifth month in a row, for a cumulative drop of 128,000 since July.
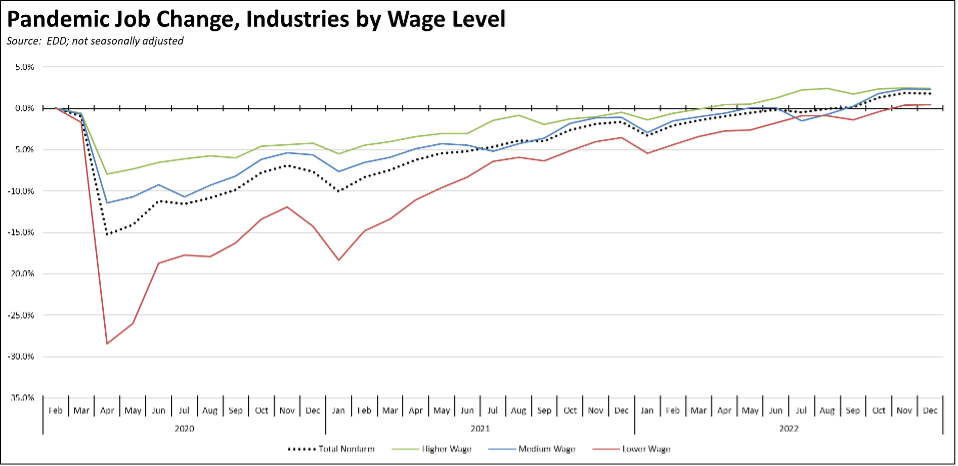
Using the unadjusted data, job numbers remained above the pre-pandemic peak in each of the three groupings of industries by wage level. Growth beyond that peak remains stronger although stalling out in the higher and middle-wage industries. Recovery under this definition remains the weakest in the lower-wage industries.
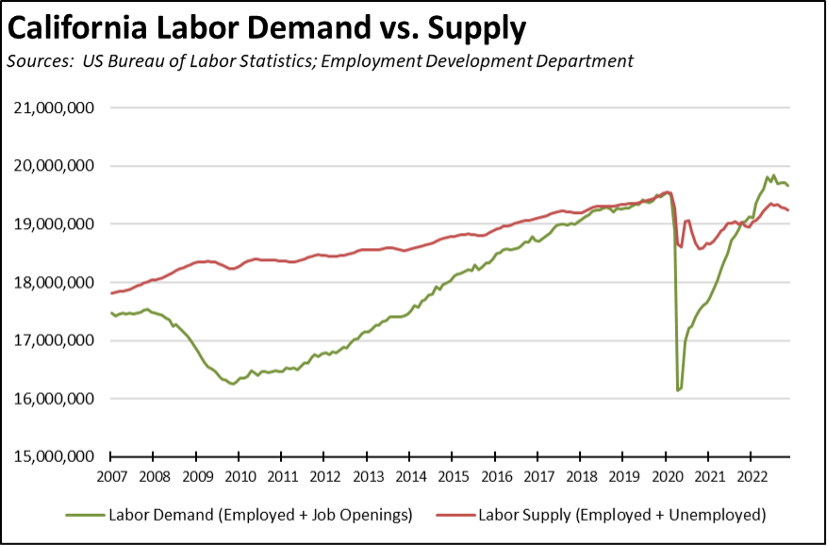
Continued jobs growth in the state also remains severely limited by labor shortages. Unfilled job openings at the end of November were little changed at 1.207 million.
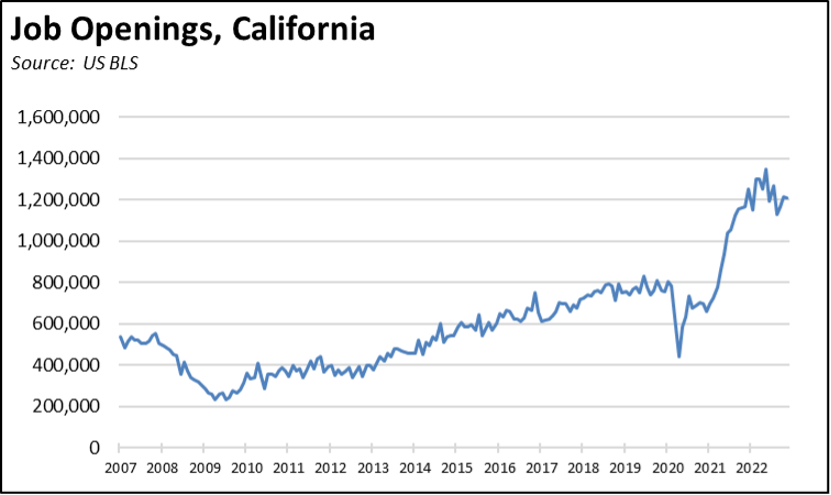
Combining unfilled job openings with the labor force data, total labor demand has exceeded the available supply since October 2021, causing the job numbers to remain well below their potential. The labor supply in fact has shrunk as the labor force has contracted since June this year. Note that the job openings data is current through November and does not incorporate the recent spate of tech industry layoff announcements in December and January.
Jobs Recovery: California Still Lags US
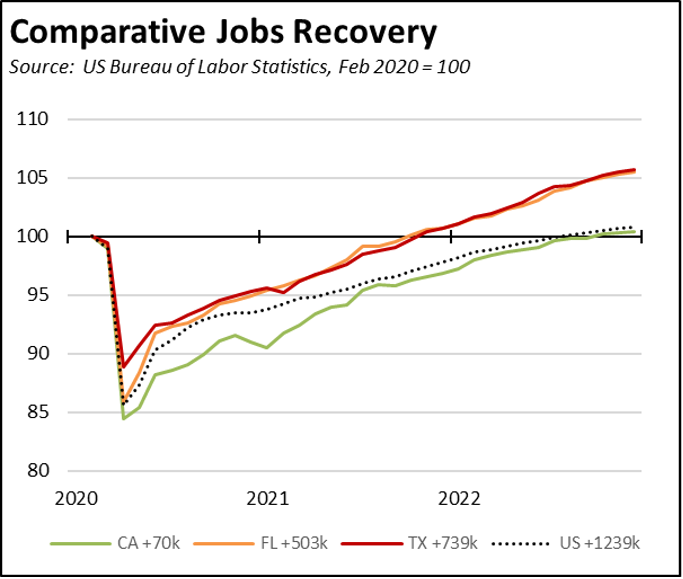
While California has experienced strong job gains over the year, the bulk has come from regaining jobs lost to the series of state-ordered closures rather than fundamental growth.
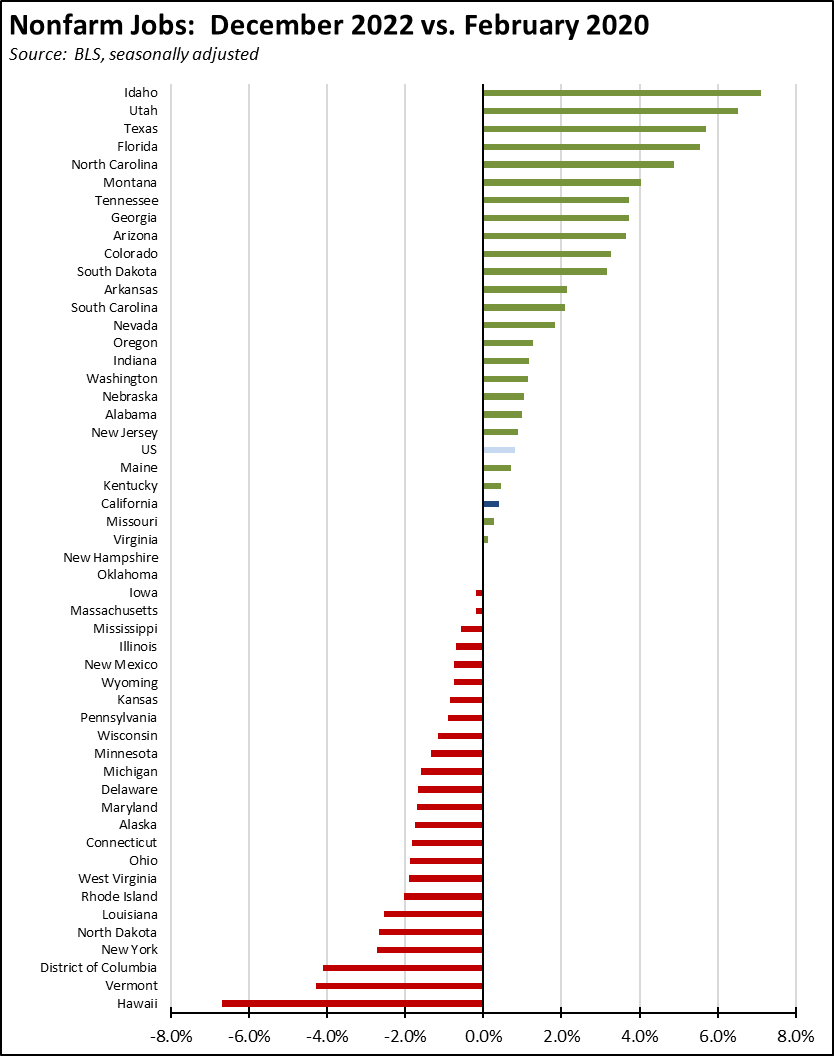
In the December numbers, California’s gains of 16,200 ranked 4th among the states, behind Texas (29,500), Florida (21,400), and Pennsylvania (17,000). For the year, California’s total gains of 621,000 were eclipsed by Texas at 650,000.
The Texas gains, however, were all growth beyond the prior pre-pandemic peak. California’s recovery with a gain of only 70,000 compared to February 2020 falls well below Texas at 739,400 and Florida at 503,000 along with six other states which recovered far earlier from the pandemic jobs effects. As shown in the chart, changes in California jobs have also been more variable due to the continued shifts in state policies in this period, while both Texas and Florida have shown a more consistent month-over-month trend. On a comparative basis, California’s job recovery still falls somewhat below the US as a whole.
CaliFormer Businesses
Additional CaliFormer companies identified since our last monthly report are shown below. The listed companies include those that have announced: (1) moving their headquarters or full operations out of state, (2) moving business units out of state (generally back office operations where the employees do not have to be in a more costly California location to do their jobs), (3) California companies that expanded out of state rather than locate those facilities here, and (4) companies turning to permanent telework options, leaving it to their employees to decide where to work and live. The list is not exhaustive but is drawn from a monthly search of sources in key cities.
CaliFormers Update
CaliFormer Indicators: WARN Act Notices
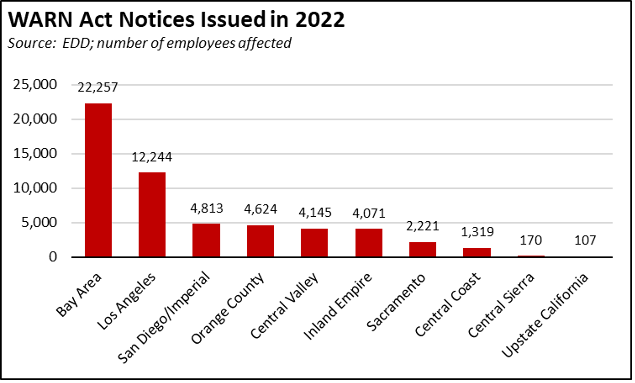
Another early indicator of job and business losses is provided through the WARN (Worker Adjustment and Retraining Notification) Act notices required in general from companies laying off 50 or more employees in a 30-day period. The notices provide only a partial view. For example, they do not include instances where companies are cutting back on hiring as opposed to actual layoffs. The notices also indicate company plans as of the notice date, and these are subject to change. The trend in the notices, however, is an indicator of the overall jobs situation and an indicator that provides results on a regional rather than state-wide basis.
Looking at the full filings for 2022 (sorted by notice date), the WARN Act notices covered a total of 55,971 workers. Of these, 40% were from businesses in the Bay Area, reflecting the recent surge in tech industry layoff announcements. As discussed in our preliminary reports, the rise in Bay Area layoffs while of concern to unemployment in general, also has greater significance to the state budget process. In the latest Franchise Tax Board data for 2020, the Bay Area produced 43.2% of total personal income tax receipts, which in turn made up 69% of total general fund revenues in 2020-21. Layoffs in this region and in particular from the tech industry consequently have an outsized effect on the fiscal health of the state budget due to its highly skewed revenue model.
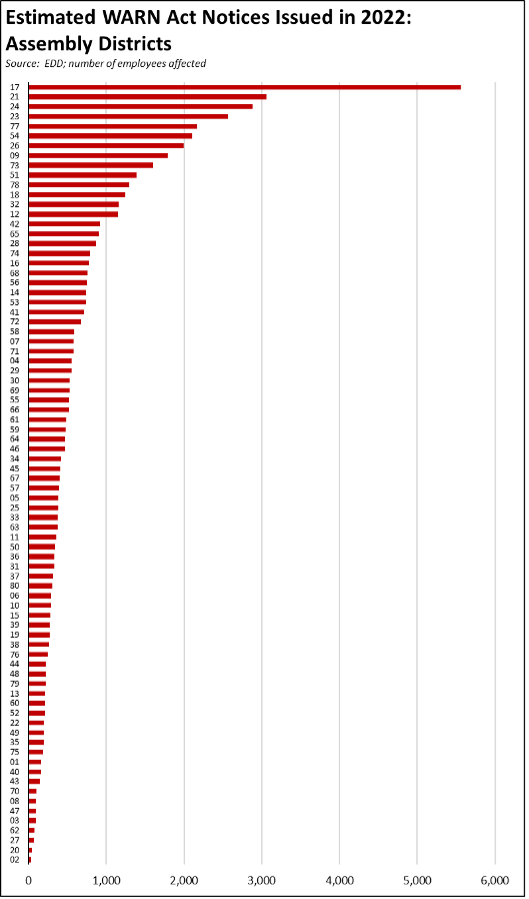
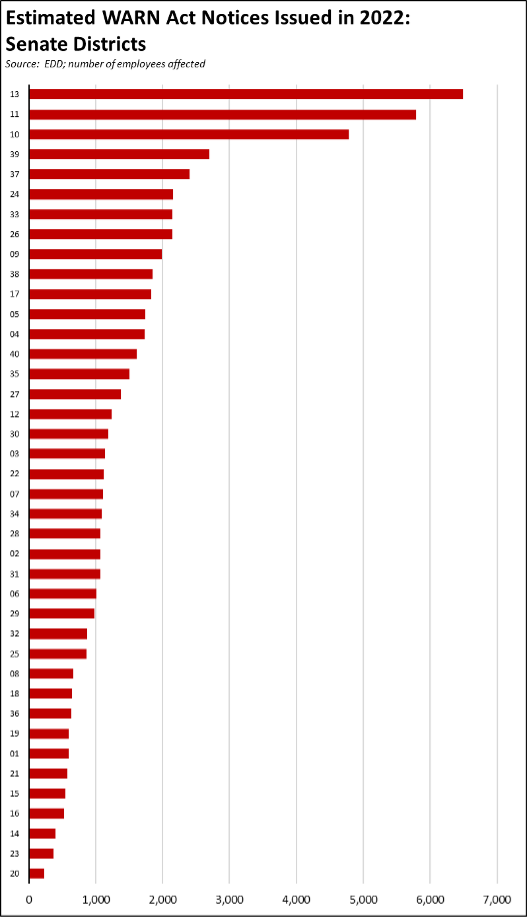
The disproportionate incidence of the notices is also reflected in the estimates of workers affected by legislative district. In the Assembly, the top 10 districts accounted for an estimated 45% of all layoffs in 2022. In the Senate, the top 10 accounted for 52%.
Although it is still early in the year, this pattern is continuing in 2023. Of the 7,096 workers affected by notices in the first three weeks of January, 43% have been in the Bay Area.
CaliFormer People
In addition to businesses, the latest population estimates from the Census Bureau indicate that people continue to leave the state as well. Combined with revisions to the previous estimates for 2010-19 based on the 2020 Census results, these recent numbers show California’s population essentially stopped growing in 2019, and fell a combined 472,000 in 2021 and 2022.
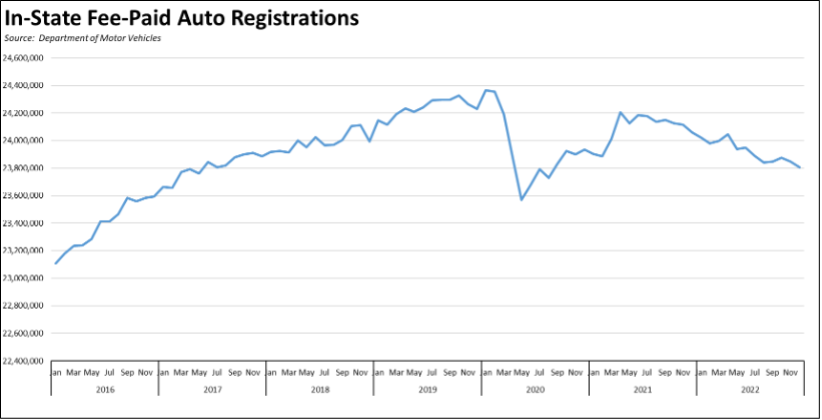
These population losses likely are continuing at the same rate. While the data was affected by the immediate effects during the pandemic period, the in-state vehicle registration data from Department of Motor Vehicles shows a fairly consistent decline since 2021.
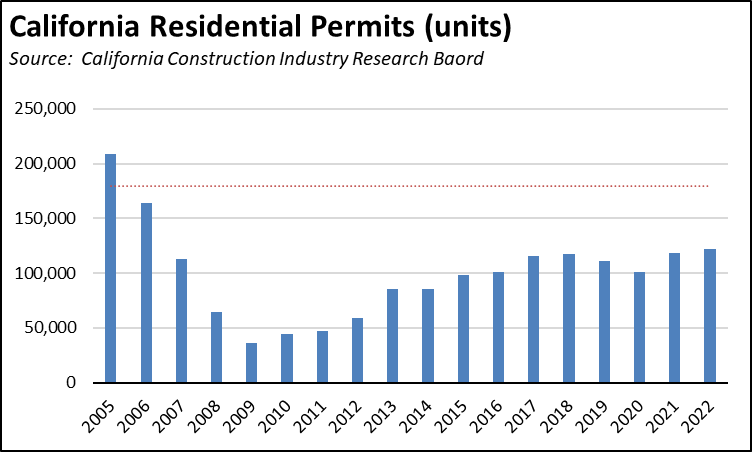
To put these numbers in perspective, the most recent Statewide Housing Plan is based on previous projections showing California needs to be creating 180,000 units of housing each year just to keep up with population growth and reductions in the housing stock due to fires and other causes leading to demolition. As widely reported, California has failed to keep up this need let alone the higher numbers contained in that plan to maintain pace with population and catch up on the prior year shortfalls. Even though marginally improved, the latest permit results from the Construction Industry Research Board show that the 2022 numbers still fell short of the 180,000 goal by a third.
The separate Census Bureau data shows that in 2022, the 180,000 units needed annually to house Californians are being built, but this construction is taking place in the states to which Californians are moving including Texas (245,601 units in 2022) and Florida (190,943) compared to California at only 104,874.
California instead now appears to be meeting its housing needs in part by housing prices and lack of job opportunities, especially in the middle-class wage blue collar jobs expanding more strongly in other states, that are pushing people to look elsewhere for economic opportunity and lower costs of living.
Since the population essentially stopped growing in 2019, California housing permits have covered a total of 452,000 units, or 268,000 below the annual goals. As shown in the calculations below, this shortage instead was roughly matched by reductions in anticipated demand as people left the state. From this perspective, California may be meeting its housing goals, but it is doing so by policies that raise the cost of living and drive people to find housing they can afford in other states.
How Much Less Housing Needed Because People are Leaving California?
| Total new residential permits, 2019-2022 (CIRB) | 452,000 |
| Total new housing required, 2019-2022; 180,000 units annually | 720,000 |
| Shortfall | -268,000 |
| Population growth, 2019-2022, Census Bureau estimates | -408,000 |
| Population growth, 2019-2022, DOF projections | 476,000 |
| Shortfall | -884,000 |
| Housing units @ 2.94 persons per household | 301,000 |
Nonfarm Jobs: 70,000 Above Pre-Covid Peak
Nonfarm wage and salary jobs were up 16,200 (seasonally adjusted) in November, while the estimated gains in November were revised down to 19,900.
The November results put California nonfarm jobs 70,000 above the pre-pandemic peak, joining 26 other states with positive jobs growth since February 2020.
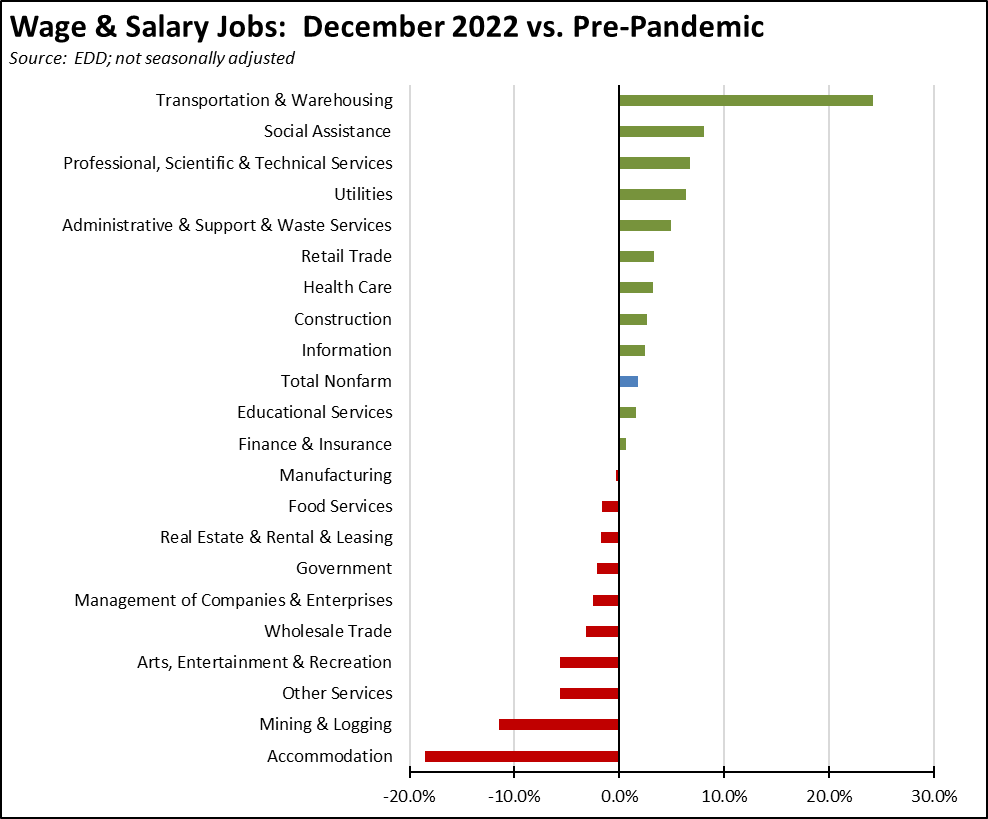
Jobs Change by Industry
Using the unadjusted numbers that allow a more detailed look at industry shifts, the number of industries showed job levels at or exceeding the pre-pandemic February 2020 levels remained at 11. Transportation & Warehousing again showed the strongest cumulative jobs growth (160,900), or just shy of the next two highest gainers combined—higher-wage Professional, Scientific & Technical Services (92,000) and Social Assistance (69,800) which is comprised primarily of government-paid In-Home Supportive Service workers. Accommodations remained the most behind, while Mining & Logging continued to reflect state policies to eliminate the higher wage jobs in this industry.
Employment 293,300 Below Pre-Covid Level
Employment (seasonally adjusted; November preliminary) continued to lose ground for the fifth month in a row, down 20,000 from the revised numbers for November. The number of unemployed dipped 6,200.
The reported unemployment rate was unchanged at 4.1%. California had the 12th highest unemployment rate among the states, and contained 13.7% of the total number of unemployed workers in the US.
In the national numbers, total US employment rose 717,000, and the number of unemployed dropped 278,000. The reported unemployment rate improved 0.1 point to 3.6%.
Figure Sources: California Employment Development Department; US Bureau of Labor Statistics
Labor Force Participation Rate
The California labor force participation rate again dipped 0.1 point to 62.1%, while the US number moved up 0.1 point to 62.3%. The California rate still remains below the pre-pandemic level of 62.8%, which in turn was down substantially from prior years. Accounting for workers leaving the workforce since February 2020, there were an estimated 1.0 million out of work in December.
Unemployment Rates by Legislative District
We will be pausing publication of these estimates until the necessary data is available for the new legislative district boundaries from the American Community Survey.
Unemployment Rates by Region
Unemployment rates (not seasonally adjusted) compared to pre-pandemic February 2020 are shown below.
Figure Source: California Employment Development Department
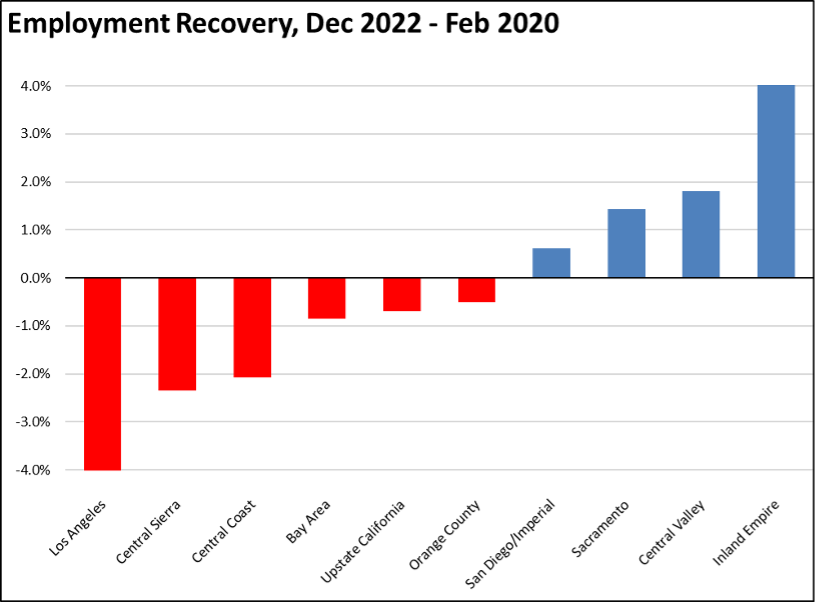
Employment Recovery by Region
There was little change in the overall regional employment situation compared to the pre-pandemic peaks. Los Angeles Region continues to lag the rest of the state in recovery.
MSAs with the Worst Unemployment Rates
The number of California MSAs among the 25 regions with the worst unemployment rates in November rose from 10 to 11. Los Angeles-Long Beach-Anaheim MSA slipped to #309 in a tie with 9 other MSAs in other states. The best performing California urban region was again San Jose-Sunnyvale-Santa Clara MSA, dropping to a tie with 13 other MSAs at #49, with an unemployment rate of 2.4% compared to the best performing region, Fargo, ND-MN MSA, at 1.5%.