Highlights for policy makers:
- Unemployment Rate Eases to 5.1%; Total Employment Up 11,000
- Nonfarm Jobs Increase 3,700
- 6 Industries below 2007 Pre-Recession Job Levels
- Two-Tier Economy Persists
- 7 California MSAs in the 10 Worst Unemployment Rates Nationally
- California U-6 Unemployment Eases to 11.3%
Employment Development Department and Bureau of Labor Statistics are currently going through their annual data revision process. The Center’s data series and data estimates will be updated as the revisions become available, with the final revisions released in late April. Until the process is completed, however, some of the historical comparisons will remain incomplete.
Unemployment Rate Eases to 5.1%; Total Employment Up 11,000
The Labor Force data for Janurary 2017 (seasonally adjusted; California preliminary) is shown below, along with the change from the prior month:
| Seasonally Adjusted | California | US | ||
|---|---|---|---|---|
| Jan 2017 | Change from Dec 2016 | Jan 2017 | Change from Dec 2016 | |
| Unemployment Rate | 5.1 | -0.1 | 4.8 | 0.1 |
| Labor Force | 19,162,500 | 0.0% | 159,716,000 | 0.0% |
| Participation Rate | N/A | N/A | 62.9 | .2 |
| Employment | 18,176,000 | 0.1% | 151,081,000 | 0.0% |
| Unemployment | 986,500 | -1.3% | 7,635,000 | 1.4% |
The related not seasonally adjusted numbers (California preliminary), with the change from January 2016:
| Not Seasonally Adjusted | California | US | ||
|---|---|---|---|---|
| Jan 2017 | Change from Jan 2016 | Jan 2017 | Change from Jan 2016 | |
| Unemployment Rate | 5.5 | -0.3 | 5.1 | -0.2 |
| Labor Force | 19,082,500 | 0.7% | 159,676,000 | 0.8% |
| Participation Rate | N/A | N/A | 62.5 | 0.2 |
| Employment | 18,033,300 | 1.1% | 150,527,00 | 1.0% |
| Unemployment | 1,049,200 | -5.2% | 8,149,000 | -1.9% |
California Employment Development Department’s (EDD) latest release shows on a seasonally adjusted basis, total employment rose 11,000 from December 2016, while the number of unemployed declined by 12,500. Total labor force remained largely unchanged with a dip of only 2,500.
Total US employment saw a seasonally adjusted increase of 30,000 from December, while the number of unemployed increased by 106,000 as additional workers were drawn back into the labor force. The national unemployment rate rose 0.1 point to 4.8%.
Nonfarm Jobs Increase 3,700
EDD reported that between December 2016 and January 2017, seasonally adjusted nonfarm wage and salary jobs grew 9,700 in January. December’s gains were revised up marginally to 4,400 from the previously reported gain of 3,700.
Looking at the not seasonally adjusted numbers, job levels saw their usual seasonal drop-off from December 2016 to January 2017. Over the year, hiring saw increases in all but two industries. The change in total payroll jobs from January 2016 saw the largest increases in Health Care & Social Assistance (75,900), Government (50,100), and Accommodation & Food Services (36,200). Declines were in Manufacturing (-5,800) and Mining & Logging (-3,300).
| Not Seasonally Adjusted Payroll Jobs | Dec 2016 | Jan 2016 | Change Jan 2017 – Dec 2016 | Change Jan 2017 – Jan 2016 |
|---|---|---|---|---|
| Total Farm | 362,100 | 361,000 | -1,100 | 10,100 |
| Mining & Logging | 23,100 | 22,400 | -700 | -3,300 |
| Construction | 774,000 | 746,100 | -28,100 | 8,800 |
| Manufacturing | 1,298,400 | 1,286,900 | -11,500 | -5,800 |
| Wholesale Trade | 733,000 | 725,400 | -7,600 | 12,000 |
| Retail Trade | 1,776,900 | 1,687,300 | -89,600 | 16,500 |
| Transportation, Warehousing & Utilities | 611,900 | 587,000 | -24,900 | 18,900 |
| Information | 524,900 | 518,000 | -6,900 | 9,700 |
| Finance & Insurance | 551,200 | 548,400 | -2,800 | 10,900 |
| Real Estate & Rental & Leasing | 283,600 | 279,400 | -4,200 | 7,900 |
| Professional, Scientific & Technical Services | 1,234,600 | 1,226,600 | -8,000 | 25,800 |
| Management of Companies & Enterprises | 228,200 | 226,900 | -1,300 | 2,300 |
| Administrative & Support & Waste Services | 1,096,900 | 1,067,200 | -29,700 | 1,700 |
| Educational Services | 367,500 | 352,900 | -14,600 | 8,600 |
| Health Care & Social Assistance | 2,217,400 | 2,216,400 | -1,000 | 75,900 |
| Individual & Family Services | 608,600 | 612,200 | 3,600 | 25,300 |
| Arts, Entertainment, & Recreation | 301,500 | 286,000 | -15,500 | 3,300 |
| Accommodation & Food Service | 1,613,200 | 1,578,000 | -35,200 | 36,200 |
| Other Services | 561,300 | 556,400 | -4,900 | 14,600 |
| Government | 2,565,700 | 2,544,700 | -21,000 | 53,900 |
| Total Nonfarm | 16,763,500 | 16,456,000 | -307,500 | 297,900 |
| Total Wage & Salary | 17,125,600 | 16,817,000 | -308,600 | 308,000 |
6 Industries Below 2007 Pre-Recession Job Levels
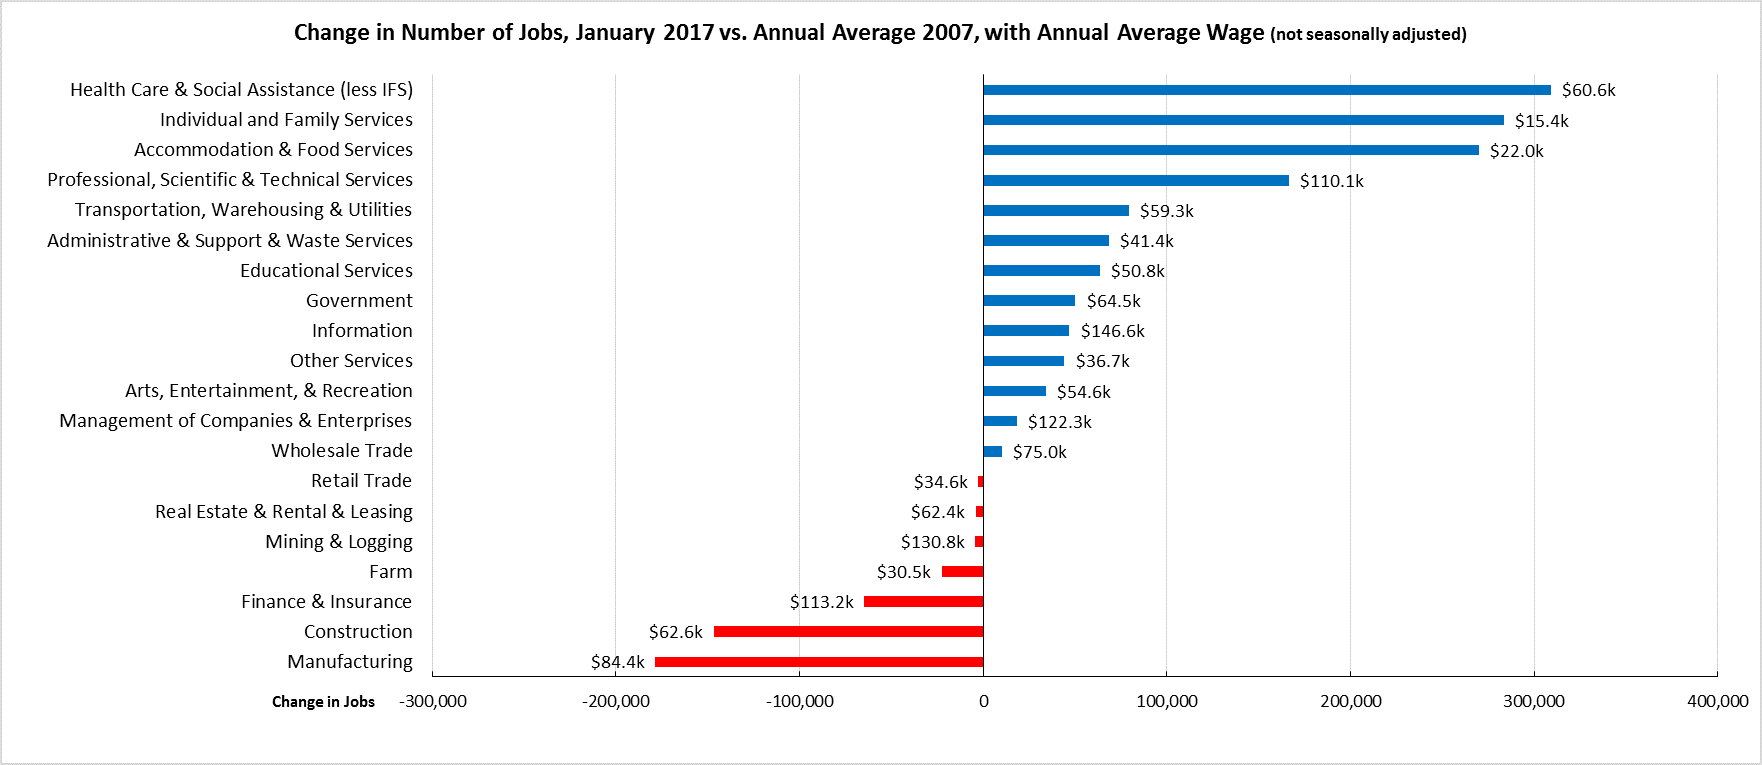
Comparing the number of jobs by industry in January 2017 (not seasonally adjusted), 6 industries had employment below the 2007 pre-recession levels. In the highest gain industries, Health Care & Social Assistance (less IFS) remained the leading industry, followed by the two lowest wage industries (Accommodation & Food Services and Individual & Family Services) and higher wage Professional, Scientific & Technical Services. Of the lagging industries, three—Manufacturing, Mining & Logging, and Construction—are blue collar middle class wage industries, while the higher wage Finance & Insurance also continued to lose ground.
Two-Tier Economy Persists
Unemployment rates (all data is not seasonally adjusted) continue to vary widely across the state, ranging from 3.8% in the Bay Area to 10.5% in the Central Valley.
| Not Seasonally Adjusted | Unemployment Rate (%) November 2016 |
|---|---|
| California | 5.5 |
| Bay Area | 3.8 |
| Orange County | 3.9 |
| Los Angeles | 5.1 |
| San Diego/Imperial | 5.2 |
| Sacramento Region | 5.3 |
| Inland Empire | 5.6 |
| Central Sierra | 6.2 |
| Upstate California | 8.0 |
| Central Coast | 8.5 |
| Central Valley | 10.5 |
7 California MSAs in the 10 Worst Unemployment Rates Nationally
Of the 10 Metropolitan Statistical Areas (MSAs) with the worst unemployment rates nationally, 7 are in California. Of the 20 worst, 12 are in California.
| Metropolitan Area | December 2016 Unemployment Rate | Rank |
|---|---|---|
| Brownsville-Harlingen, TX Metropolitan Statistical Area | 7.3 | 368 |
| Beaumont-Port Arthur, TX Metropolitan Statistical Area | 7.4 | 369 |
| Santa Cruz-Watsonville, CA Metropolitan Statistical Area | 7.5 | 370 |
| Kennewick-Richland, WA Metropolitan Statistical Area | 7.8 | 371 |
| Stockton-Lodi, CA Metropolitan Statistical Area | 8.0 | 372 |
| McAllen-Edinburg-Mission, TX Metropolitan Statistical Area | 8.2 | 373 |
| Farmington, NM Metropolitan Statistical Area | 8.3 | 374 |
| Modesto, CA Metropolitan Statistical Area | 8.3 | 374 |
| Madera, CA Metropolitan Statistical Area | 9.4 | 376 |
| Fresno, CA Metropolitan Statistical Area | 9.5 | 377 |
| Yuba City, CA Metropolitan Statistical Area | 9.8 | 378 |
| Bakersfield, CA Metropolitan Statistical Area | 9.9 | 379 |
| Hanford-Corcoran, CA Metropolitan Statistical Area | 9.9 | 379 |
| Salinas, CA Metropolitan Statistical Area | 9.9 | 379 |
| Yakima, WA Metropolitan Statistical Area | 9.9 | 379 |
| Merced, CA Metropolitan Statistical Area | 10.8 | 383 |
| Ocean City, NJ Metropolitan Statistical Area | 11.5 | 384 |
| Visalia-Porterville, CA Metropolitan Statistical Area | 11.5 | 384 |
| Yuma, AZ Metropolitan Statistical Area | 15.3 | 386 |
| El Centro, CA Metropolitan Statistical Area | 18.8 | 387 |
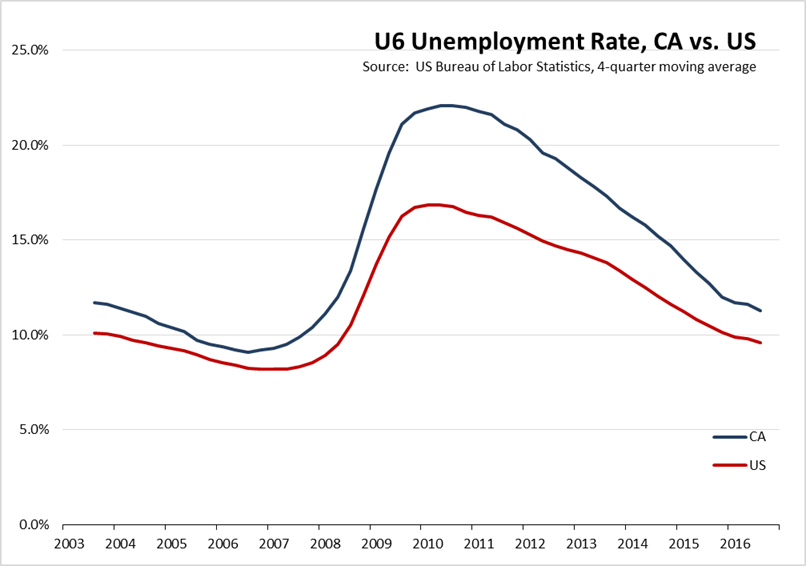
California U-6 Unemployment Rate Eases to 11.3%
The broadest unemployment measure, U-6, incorporates number of unemployed, marginally attached workers, and persons employed part time for economic reasons. On a 4-quarter moving average, the 2016 rate eased to 11.3% from 11.6% in the third quarter. California’s rate compared to the US is shown in the figure below.
Note: All data sources, methodologies, and historical data series available at CenterforJobs.org.