Download January 2019 Jobs Report
Highlights for policy makers:
- Unemployment Rises to 4.2%; Employment Up 35,200
- Labor Force Participation Rate Rises to 62.7%
- Labor Force by Age
- Employment Growth Ranking—California Back to 1st
- Nonfarm Jobs Up 24,500 for Month; California Remains Ranked #2 for 12-month Gain
- Jobs Change by Industry
- Structural Shifts in State’s Economy
- Unemployment Rates by Region
- Employment Growth by Region
- 20 MSAs with the Worst Unemployment Rates
- Chart of the Month: WARN Act Notices
Unemployment Rises to 4.2%; Employment Up 35,200
EDD’s revised data shows total employment (seasonally adjusted; January preliminary) was up 35,200 from December, while the number of unemployed rose 15,000. Unemployment rate rose to 4.2% primarily as a result of continued slow growth in the labor force. The unadjusted rate rose 0.1 point from the year earlier to 4.8%.
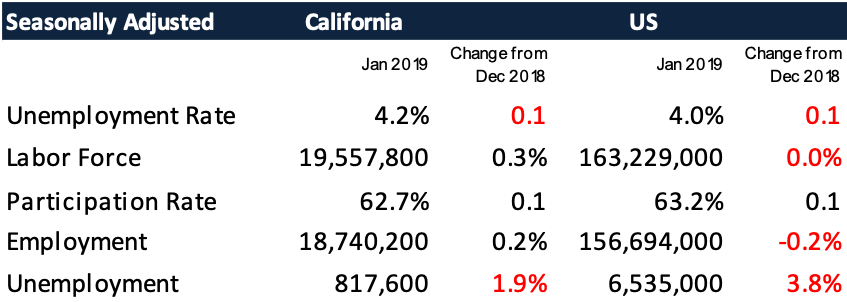
California tied with Kentucky for the 13th highest unemployment rate.
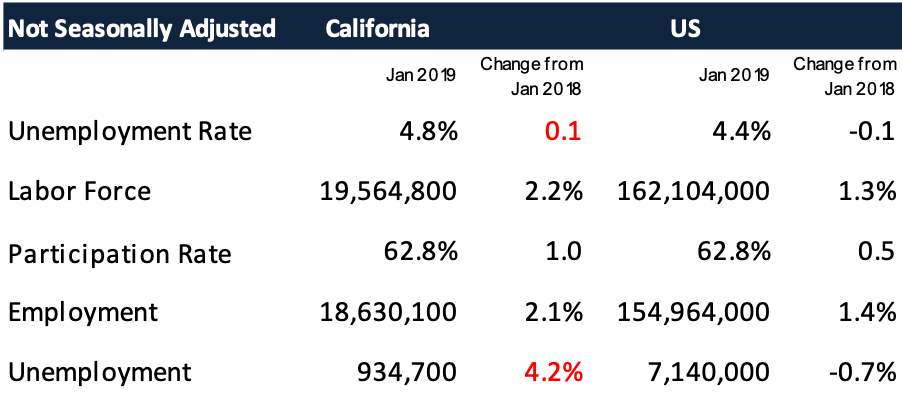
Figure Sources: California Employment Development Department; US Bureau of Labor Statistics
Total US employment saw a seasonally adjusted loss of 251,000, with the number of unemployed dropping 241,000. The unemployment rate rose to 4.0%.
Labor Force Participation Rate Rises to 62.7%
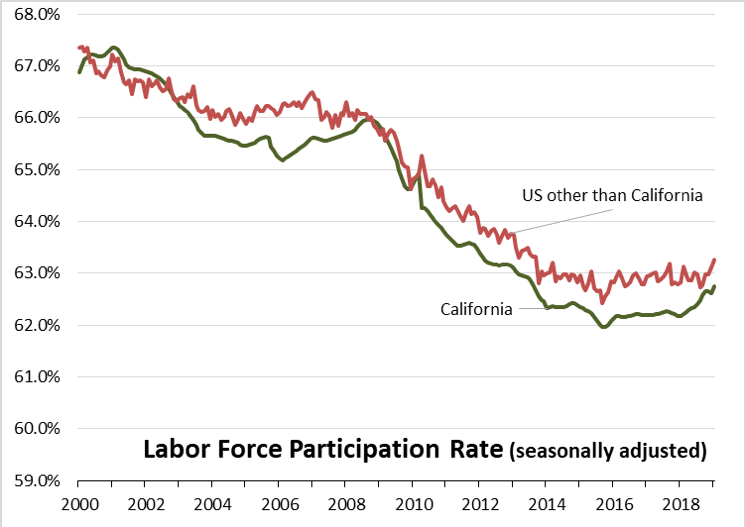
Figure Sources: California Employment Development Department; US Bureau of Labor Statistics
California’s seasonally adjusted labor force participation rate rose to 62.7% as additional workers reentered the workforce. Nationally, the participation rate showed a comparable rise. Although the gap has narrowed, the state continues to experience lower than average participation rates in spite of having a relatively younger population than the rest of the US.
The revised labor force data show a more sustained but modest rise in the participation rate beginning in December 2015. For the 12 months ending January 2019, the seasonally adjusted data shows the California labor force grew 1.5% compared to the rest of the US at 1.3%.
Labor Force by Age
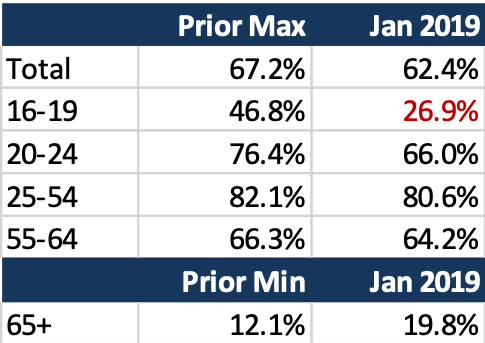
Figure Source: California Employment Development Department
Labor force participation by age (12-month running average) grew for all groups except for youth age 16-19. The continued low rates for youth and young adults in particular have implications for life-time earnings potential due to the delay in acquiring essential workplace skills.
Employment Growth Ranking—California Back to 1st
![]()
Figure Sources: California Employment Development Department; US Bureau of Labor Statistics
Over the 12 months ending in January, the total number of persons employed (seasonally adjusted) grew by 321,900. As a result of the data revisions, California was in 1st place ahead of Texas, which saw an additional 252,100 persons employed over this period.
Based on percentage growth, California had a 1.7% expansion in employment, above the US average of 1.4%. Ranked among the states, California rose to 10th place, while Arizona led at 3.4%.
Nonfarm Jobs Up 24,500 for Month; California Remains Ranked #2 for 12-month Gain
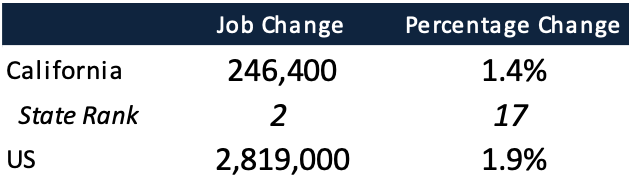
Figure Sources: California Employment Development Department; US Bureau of Labor Statistics
Nonfarm jobs (seasonally adjusted) were up 3,000 from December. December’s gains were revised to 19,700 from the previously reported 24,500.
For the 12 months ending January, total jobs growth was 246,400, keeping the state in 2nd place behind Texas which gained 292,000 jobs in this period.
On a percentage basis, California rose to 17th among the states, with a 12-month jobs growth rate of 1.4% vs. the US average of 1.9%.
Jobs Change by Industry
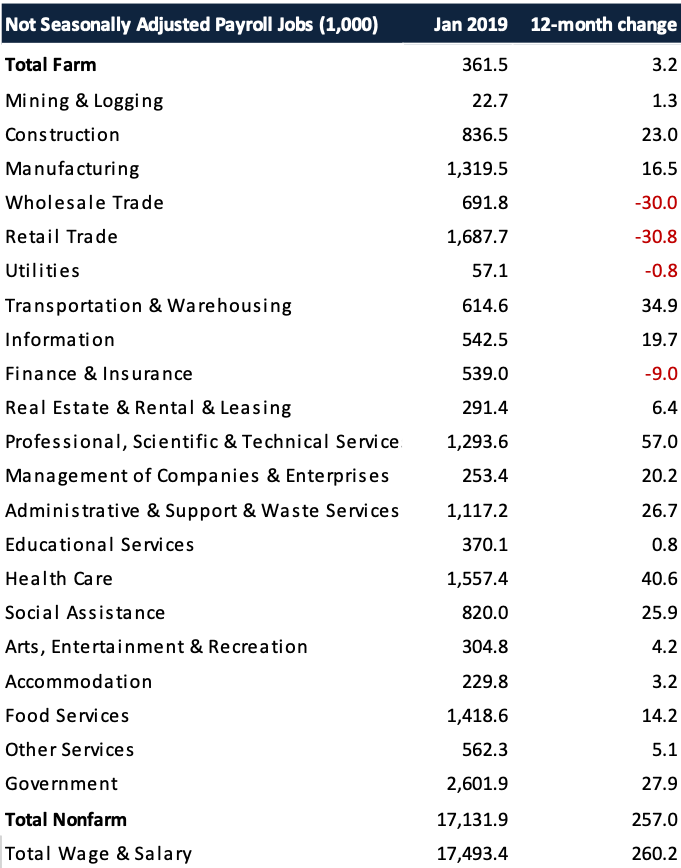
Figure Source: California Employment Development Department
In the unadjusted numbers that allow a more detailed look at industry shifts, hiring saw increases in all but 4 industries over the year.
Gains in payroll jobs were led by Professional, Scientific & Technical Services ($120.4k average annual wages), Health Care ($67.3k), and Transportation & Warehousing ($55.8k).
Declines were led by Retail Trade ($36.0k), Wholesale Trade ($78.7k), and Finance & Insurance ($127.0k).
All wage data is from the most current 4-quarter average from the Quarterly Census of Employment & Wages.
Structural Shifts in State’s Economy
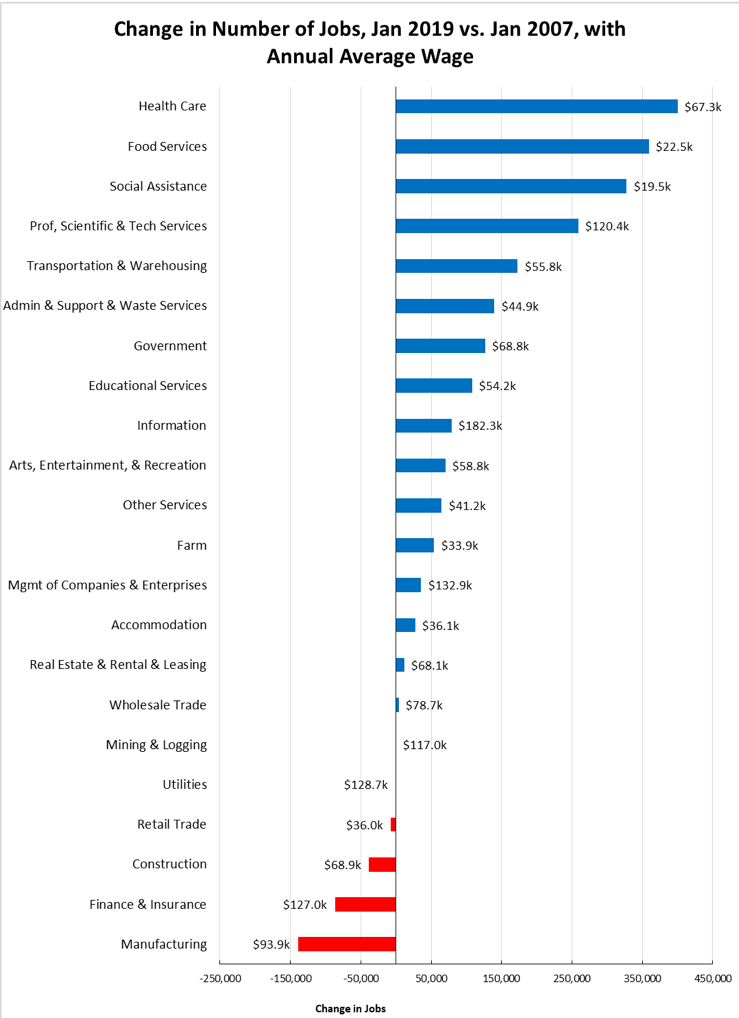
Figure Source: California Employment Development Department
Comparing current job numbers to the pre-recession levels in 2007 illustrates the structural shift in the state’s economy, with the primary jobs growth occurring in the higher and lower wage industries.
Jobs growth within the traditional middle class wage—especially blue collar industries such as Manufacturing, Construction, and Mining & Logging—continues to lag. Finance & Insurance also continues to lose ground. Of these, Construction has gained ground in the past year as activity has picked up. However, construction jobs remain 83,300 below the 2007 peak—in part due to seasonal factors—and 129,800 (13%) below the pre-recession high in 2006.
Unemployment Rates by Region
| California | 4.8 |
| Bay Area | 3.2 |
| Orange County | 3.3 |
| Sacramento | 4.3 |
| San Diego/Imperial | 4.5 |
| Inland Empire | 4.6 |
| Los Angeles | 4.9 |
| Central Sierra | 5.1 |
| Central Coast | 7.1 |
| Upstate California | 7.1 |
| Central Valley | 8.8 |
Employment Growth by Region
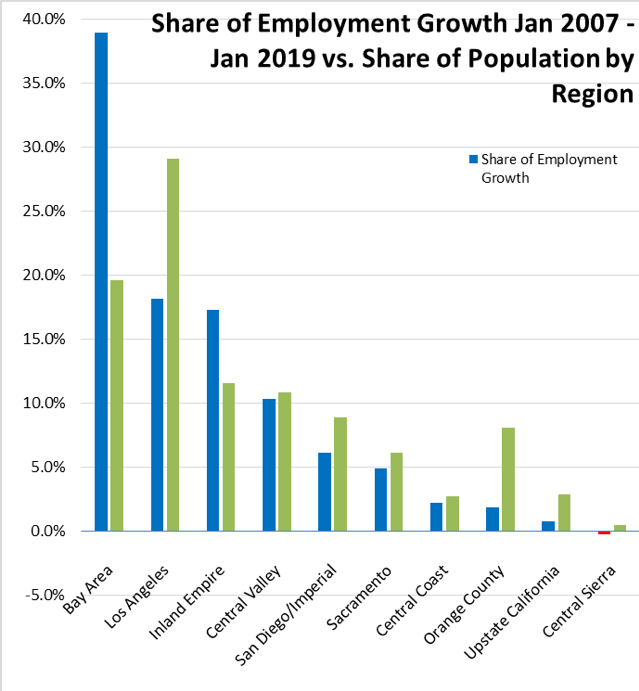
Figure Sources: California Employment Development Department; Department of Finance
Containing 19.6% of the state’s population, the Bay Area has accounted for 38.9% of net employment growth compared to pre-recession levels.
Illustrating the significant effect of housing prices on commuting patterns and therefore energy and global warming emission levels, Inland Empire remained in second place at 18.1%.
Los Angeles Region, with 29.1% of the population, accounted for only 17.2% of net employment gains.
20 MSAs with the Worst Unemployment Rates
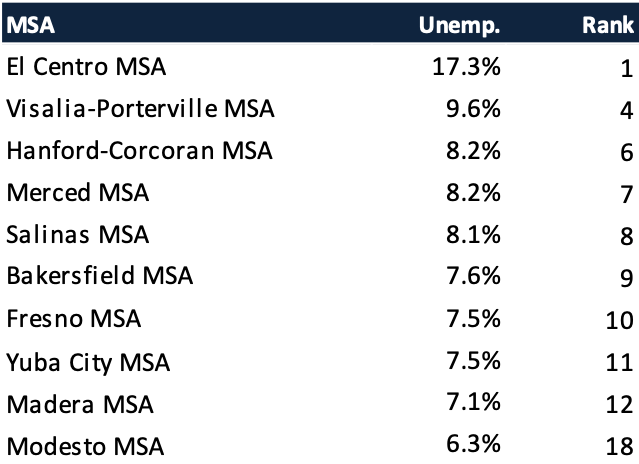
Figure Source: US Bureau of Labor Statistics, December 2018 data
Of the 20 Metropolitan Statistical Areas (MSAs) with the worst unemployment rates in December 2018, 10 are in California, including El Centro MSA (Imperial County) with the highest unemployment rate in the country.
Chart of the Month: WARN Act Notices
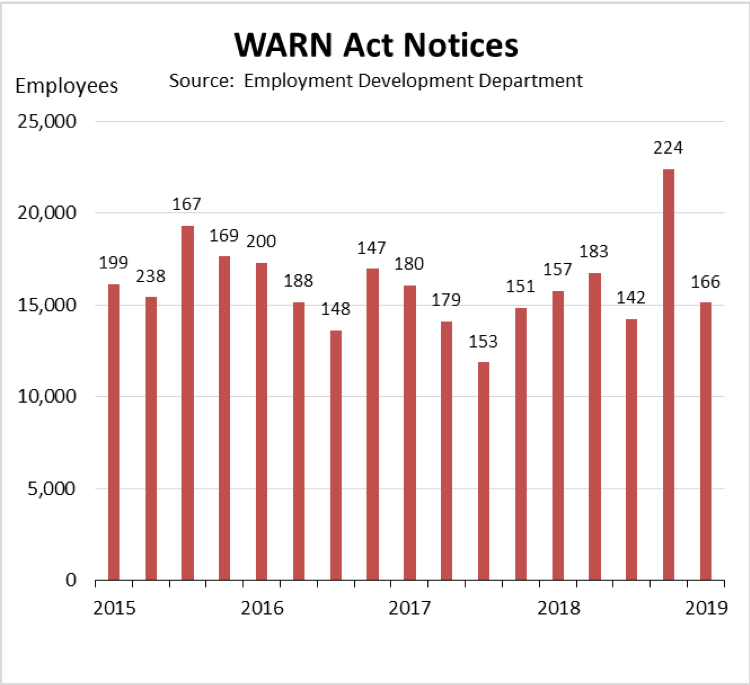
Under the State Worker Adjustment and Retraining Notification (WARN) Act, employers are required to issue a 60-day notice prior to a plant closing or mass layoff. The chart shows the number of employees affected by quarter, along with the number of notices issued.
WARN Act activity was up overall in 2018—706 notices covering 69,084 employees—at a level comparable to 2015.
Note that any final employee actions may differ from the number originally reported in the required notice. Companies may also issue revised notices affecting the same facility, but the EDD summary totals do not account for this factor.
Data Note
All labor force and jobs data above reflects the annual revisions to the historical data by EDD and BLS. The Center’s data series have been updated as well. In general, the revisions affect data beginning in 2014 for the US, states, and Los Angeles County, although in some cases the revisions extend back to 1990.
The final revisions for substate areas will be released along with the February data on March 23. At that time, we will also revise the Legislative District estimates to incorporate the BLS/EDD revisions along with the updated American Community Survey factors.