Highlights for policy makers:
- COVID-19 and the State Economy
- Employment: 1.599 Million Below Recovery
- Labor Force Participation Rate Drops to 60.0%
- Employment Growth Ranking
- Nonfarm Jobs: 1.793 Million Below Recovery
- Jobs Change by Industry
- Unemployment Rates by Region (not seasonally adjusted)
- How Far Back Has the Economy in Each County Been Pushed?
- MSAs with the Worst Unemployment Rates: Los Angeles 23rd Worst in Nation
COVID-19 and the State Economy
Reflecting both the annual revisions in the data and the state’s stay-at-home orders during this period, the January results show a deterioration in the state’s recovery, both when considered alone and when compared to the results in the other states. As detailed later, California’s share of employment and job losses over the year were nearly twice as large as its share of the US population.
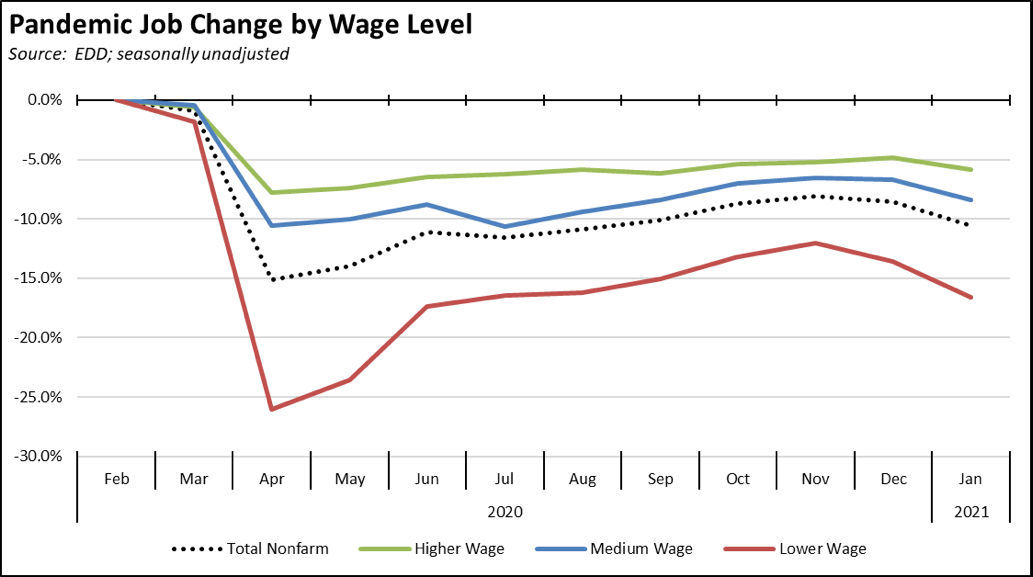
The January results also indicate a continued disparate impact on the lower wage workers who have been affected the greatest during the state-ordered shutdowns. While jobs in the higher and medium wage industries also experienced some easing in January, just over half of total job losses were in the lower wage industries. In the chart, higher wage jobs are those industries with average annual wages above $100,000; medium wage is $50,000 to $100,000; and lower wage is below $50,000. Job data is drawn from the industry classifications, unadjusted job numbers, and wage levels shown in the regular report section below on Nonfarm Jobs.
January Numbers in Context: Technical Note
The January data contains the first step in the annual state revision process for both the labor force and jobs numbers. Labor force data for both the states and Los Angeles County reflects revisions beginning in 1976. The jobs data was revised beginning in 2016, but includes some components revised beginning in 1990. All charts and calculations are based on these revisions. The remaining counties will be updated with the February data to be released later this month. The legislative district estimates will be updated when those revisions are available.
CaliFormer Update: Is the “California Exodus” Being Exaggerated?
Both the incidence and extent of migration from California—especially by the high-tech businesses and high-tech workers that produce an outsized share of state revenues—continue to be debated in a series of new reports:
- Looking at change-of-address data for March to November, San Francisco Chronicle concluded that earlier stories of migration out of the state were overstated. Their analysis indicated that only 3.7% of moves from San Francisco were to other states. The remainder were moves within the Bay Area or to surrounding counties.
- Using their California Consumer Credit Panel developed from all Californians with credit history, California Policy Lab found a similar pattern of moves, with an increase in the number of people moving from the Bay Area (exits in the second through fourth quarter of 2020 at 31% higher than the same period in 2019, and new entrances 21% lower). Relocations again were largely to other counties within the state, but there also was higher net movement to other states of 139,000 in the fourth quarter.
- Based on the past five years of data, Pitchbook analyzed the factors that still make the Bay Area the center of venture capital investment. This report, however, also indicated Bay Area-based VCs completed more deals outside the region than locally in 2020.
- But while investments still favor the Bay Area even if to a somewhat decreasing extent, a 500 Startups survey of 122 VC investors suggests the investors themselves are moving. In the results, 6.8% have already moved to Miami; 17.0% to somewhere else in the US; 20.3% to another country; and 55.9% plan on staying in the Bay Area at least through 2021.
- Contrary to early reports that tech workers were moving to new centers such as Austin and Miami, an analysis of LinkedIn data between April and October indicates they instead are going to smaller cities such as Madison, WI, Richmond, VA, and Sacramento. On the other hand, San Francisco and New York City showed the steepest declines, while Seattle maintained its surge in tech workers that began even before the pandemic. Overall for the Bay Area, the results show only some shifts in the numbers of workers leaving the area, but a sharp decrease for people moving in. Tech workers are instead going to the smaller emerging tech centers.
The first three of these studies were immediately seized upon in some accounts as indications that earlier reports of a “California exodus” were overblown. Rather than conclusive, however, these analyses add some additional data points in an attempt to understand what is still an uncertain trend. The last two studies suggest more significant changes, but still are only early results that do not yet gauge either the potential size or length of these trends.
Regardless of the actual size of this migration, all estimates agree on one thing—it is happening. The core difference is whether it has been substantial or, as in the California Policy Lab estimates, it has been at levels that at least to date should be less cause for economic and fiscal alarm. Several important points, however, should be kept in mind:
- It is happening. Department of Finance population estimates indicate California’s population growth essentially slowed to a standstill in 2020. The lower US Census Bureau estimates indicate population was level in 2019 and began to drop in 2020. In the current circumstances, estimates differ on how many workers are moving, but at least some level of teleworking workers from the Bay Area have relocated, mostly to date to other parts of the state but to other states as well. These workers have relocated even under the enormous difficulties of doing so during a pandemic. Will more do so as conditions ease and moves become easier? Will more decide to move out of state in search of reasonable cost housing after the early telecommuting adapters have already exported coastal housing prices to the state’s inland areas? Workers and businesses are moving. It still remains to be seen how many and whether this shift will be sustained over time.
- It matters who is moving. Given the highly skewed geographic and income source of the state’s general fund, the out-migration numbers do not necessarily need to be large to represent a substantial fiscal effect. Historically from the IRS data, average household income for those moving to other states has been somewhat below the overall state average, in 2018 at $86,500 (AGI). Based on the 2018 numbers, this income level implies a general fund loss of about $2,400 in personal income tax on average per household. If instead these workers are primarily tech workers earning around $200k per household, the tax loss rises quickly to about $14,300. The state general fund revenue loss for 100,000 households (roughly, the level of net domestic migration out of the state from 2019 to 2020) in the historical instance is about a quarter of a billion dollars. The loss in the second is $1.4 billion just in income tax alone. If only 1,000 households earning over $1 million move, the loss grows even larger to $1.9 billion on average.
- The degree to which telecommuting becomes more entrenched as a dominant work arrangement matters as well. The most recent Household Pulse Survey indicates 42.3% of California households have at least one adult who is telecommuting. This number is higher in the San Francisco-Oakland-Berkeley MSA at 54.4%. Our previous estimates are that in a post-COVID economy, up to 40% of workers could do their work entirely from home, while many more could do so at least part time. Current polling indicates many workers would prefer to continue teleworking in a post-COVID economy, including a recent poll that reported 29% of professionals would quit a job if they were not allowed to do so. Part time telecommuters will likely remain in the existing work centers or move to counties within a few hours commuting time. Those doing so full time instead will be able to choose where they work, and as the tech industry expands its centers in other cities and further adopts hybrid workplace models, which tech complex they want to be near.
The Bay Area is likely to remain the mother ship for the tech industry for some time. It is still the largest concentration of these industries in the world, and still retains substantial advantages from its size, its universities, a venture capital base, and the large pool of skilled workers. But it is still far too early to jump to conclusions based on a few months of pandemic-period data whether the current migration is a one-off event or whether it becomes a lasting trend with substantial implications to the competitiveness of the state for the tech industry that has dominated California’s economic growth, and to the stability of the state’s current fiscal structure. The tech industry already draws a large number of its workers from other states and through temporary visas from other countries. A telecommuting work model allows them to continue this pattern but without the hassle of moving, Bay Area housing costs, Bay Area commutes, California taxes, and increasingly stricter California regulations on an ever-expanding universe of how people work and how people live.
The previously cited studies provide more information on the extent of the current changes affecting the state, but they are only initial evaluations based on a less than a year’s worth of data. The extent of these trends, and even the extent to which they are trends that will continue, will not likely become clear until after both businesses and workers have had time to adjust in a presumably more normal period following the current pandemic.
CaliFormer Updates: Population Loss Estimates Using Vehicle Registration Data
As previously analyzed, another estimate of population change during the current situation can be made from one of the Center’s indicators—the number of fee-paid vehicle registrations. As shown in the chart, vehicle registrations rose largely in line with population in the pre-pandemic period, only to fall significantly in the most recent months’ data. The numbers shown cover the state total for in-state light-vehicle registrations and do not include motorcycles or commercial registrations that may be used by proprietor households. As indicated in the previous month-to-month variations, the data used is also a count of registrations at a specific point in time for the purposes of the data report.
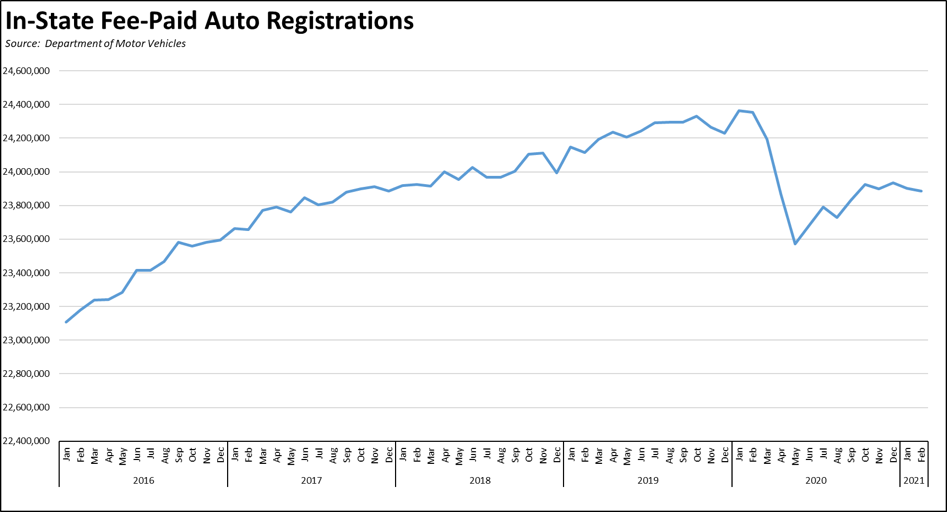
Using the data as reported, the numbers show a sharp drop as the pandemic began in March, likely due to delays in registration renewals and required smog checks. Other factors have also come into play during this period including a drop in the number of new vehicles but also, based on the sharp rise since last summer in their prices, an increase in the number of used vehicle purchases as workers turned to driving after use of public transit collapsed. The numbers, however, stabilized beginning in October into a more gradual decline and suggest changes associated with population decline.
Using the current series Department of Finance population estimates, population changes were then estimated separately both from regression analysis using these two data series and calculations based on per capita vehicle numbers. The results come out somewhat higher if the lower population projections from US Census Bureau are used instead. The numbers would also change but not substantially if analyzed by county rather than using the state-wide factors.
From this approach, total population loss between February 2019 and February 2020 ranges from 380,000 to 650,000 depending on whether the estimate is made from a regression analysis or per capita vehicle numbers.
These numbers are somewhat higher than those estimated from other secondary sources in studies cited above, but they are net numbers, incorporating the likelihood of both people leaving the state and fewer moving here. From this perspective, they are in line with although higher than recent population components of change from migration, both domestic and foreign.
CaliFormer Update: Businesses Leaving California
As indicated in our previous monthly analyses, businesses “migrate” from California in a number of ways: (1) move their entire operations, (2) move individual units, often back office or ancillary operations that do not have to be performed within the state, (3) expand in other locations rather than in the state, and (4) allowing workers to make this decision themselves through telecommuting.
Since our last update, CaliFormer companies announcing moves include the following:
| wdt_ID | Companies | From | To | Reason | Source |
|---|---|---|---|---|---|
| 2 | AB&I Foundary | Oakland | Texas | Shift production to Texas | Read More |
| 3 | Amazing Magnets | Anaheim | Austin | HQ move | Read More |
| 4 | Brex (update) | San Francisco | Shift to "remote first" work model; employees asked to live within 4 hours of Pacific Time | Read More | |
| 5 | Gilead | Foster City | North Carolina | Shift 178 backoffice jobs | Read More |
| 6 | NinjaRMM | San Francisco | Austin | HQ move | Read More |
| 7 | Salesforce (update) | San Francisco | Pulls out of lease for Parcel F Transbay tower; subleases 350 Mission St. | Read More | |
| 8 | Sightcall | San Francisco | Austin | Expansion | Read More |
| 9 | SVRS and Purple Communications | Rocklin | Austin | HQ move | Read More |
| 10 | Tanium | Emeryville | Seattle | HQ move; shift to telecommuting | Read More |
| 11 | Vio Security | Woodland Hills | Texas | HQ move | Read More |
| 12 | Coinbase | San Francisco | Shift to "remote first" work model | Read More | |
| 13 | Okta | San Francisco | Shift to "remote first" work model | Read More | |
| 14 | Spotify | San Francisco | Shift to "remote first" work model | Read More | |
| Companies | From | To | Reason | Source |
High-income taxpayers indicating they have moved include the following:
| wdt_ID | High-Income Taxpayers | Company | To | Source |
|---|---|---|---|---|
| 2 | Orion Hindawi | Tanium | Seattle | Read More |
| 6 | Survey of 122 Bay Area VC investors | Varies | 6.8% have moved to Miami; 17.0% to somewhere else in the US; 20.3% to another country; 55.9% plan on staying in Bay Area | Read More |
CaliFormer Update: Immigration & Revealed Economic Opportunity
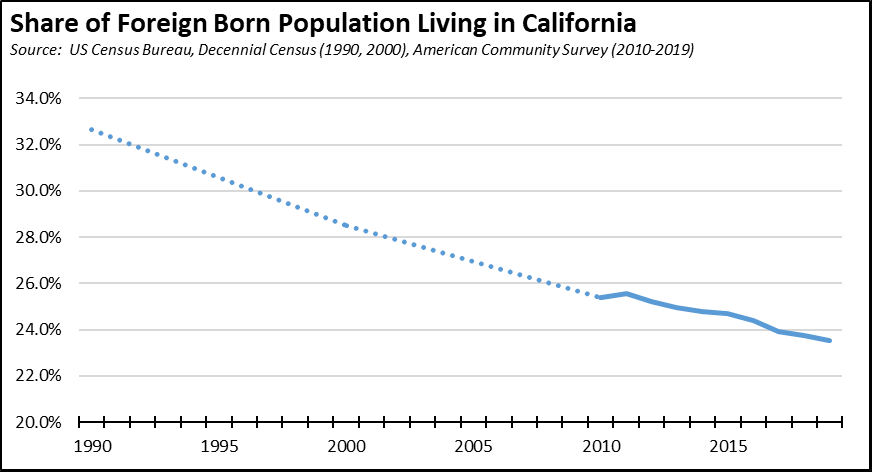
With the exception of 3 years in the 1990s, Department of Finance population estimates indicate the state has lost population through domestic migration (moves between states) almost consistently over the past three decades. Population growth instead has come from natural increases (until 2020) combined with foreign immigration.
With the exception of political refugees, immigrants are almost by definition defined by economic opportunity, being willing to leave countries where opportunities for themselves and their families are few and willing to undertake the sometimes difficult journeys to better their lives. California with its legacy of the California Dream historically attracted a large share of the foreign born population. These immigrants also formed a large share of the state’s entrepreneurial base, including those behind the creation of several of the state’s most iconic businesses.
This situation is changing. Immigrants instead increasingly are finding other states are better at providing the economic opportunities and the business climate conducive to entrepreneurship they are seeking. In 1990, California was the home to one-third of the foreign born population in the US—both noncitizens and naturalized citizens. In the latest results for 2019, that share had shrunk to less than a quarter.
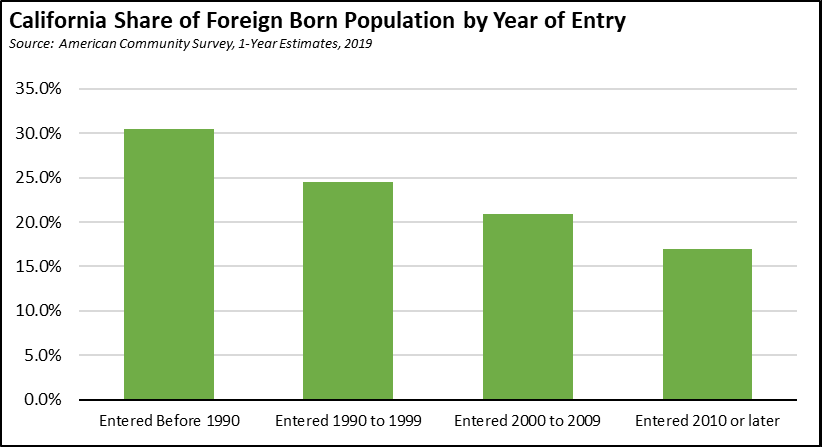
The data is even more striking when considered by year of entry. Again in the latest results from 2019, under a third (30.5%) for the foreign born population who entered the US prior to 1990 chose to live in California. For those entering in 2010 or later, only 16.9% did so, and even this number is bolstered by the high level of H1-B and other temporary visas used by the Bay Area high-tech businesses. Immigrants as a section of the population who literally votes with their feet have assessed the economic climate and opportunities in the states, and increasingly are not choosing California. While immigration has long helped define the destiny of this state, the foreign born population as the key component of population change over the past 3 decades is rapidly shifting into the ranks of the CaliFormers as well.
CaliFormer Update: Tracking the Changes in Employment
Longer term, the size and duration of any current trends will be reflected in employment, both for high-tech and other industries and incorporating the different facets including moves out the state, moves into the state, and the continuing process of internal growth both from expansions and new ventures.
In the case of the high-tech industry, the difficulty in tracking the changes comes from the fact that there is no widely accepted definition of what constitutes high-tech. Several options have been developed previously, including:
- US Bureau of Labor Statistics in a 2016 article defined high-tech industries as those having high concentrations of workers in STEM (Science, Technology, Engineering, and Mathematics) occupations, with a particular focus on STEM occupations that require a college degree and those that require less than a degree. This definition is the broadest of the four that will be used.
- Brookings Institution defined this cluster instead as innovation sector, defining on a 4-digit NAICS sector those industries with the largest potential for keeping the national economy competitive. While accounting for just 3% of the nation’s jobs in 2017, the 13 industries in this definition were responsible for two-thirds of business R&D expenditures.
- Milken Institute as part of their periodic competitiveness ranking of the states incorporates actual performance through tracking the results coming from a defined set of 20 high-tech industries.
- The 3 definitions above go beyond the typical conception of high-tech industries in the Bay Area, and include a number of more traditional businesses including chemical manufacturing, content recording, pipeline transportation, and others. Building from this, a Center Composite definition was developed using two criteria: (1) 4-digit NAICS code for the largest tech companies in the Bay Area and (2) NAICS codes from that initial list with an employment location quotient of 1 or greater. The location quotient is the result of dividing the industry (private ownership) share of total employment (all ownerships) in California by the comparable share for the US as a whole. A result above one means the industry is more concentrated within the state. The only exceptions to this second criteria were the inclusion of Management of Companies & Enterprises due to the significance of businesses (e.g., Alphabet) in this industry, and the Motor Vehicle NAICS due to the policy reliance the state has placed on electric vehicles (e.g., Tesla).
The different components within each index are shown in the table below. In all cases, industries were re-specified as necessary to the 4-digit NAICS level. The only exception is Commercial & Service Industry Machinery which is used at the 3-digit level due to data disclosure restrictions on some of the states used in the comparisons.
As shown in the overall location quotients shown at the bottom of the table, California has the highest relative share within the Brookings definition, but still has a higher concentration of high-tech jobs under all four definitions compared to the US averages.
In looking at relative jobs performance among selected states, the emergence of competing tech centers has been building for some time, but began accelerating under most of the definitions beginning around 2016. In each instance, employment is measured against an index to the November 2009 levels, chosen as the general low point for high-tech employment in California reached during the previous recession.
As indicated in the charts, even prior to the current period, a number of the key states shown were performing at rates comparable to California. Under some of the definitions, others such as Utah and Washington, were doing far better. The most often cited competitors—Texas and Florida—indicate more mixed outcomes that are dependent on which definition is being used.
Looking at a broader comparison of recent comparative performance, the following table summarizes jobs performance for a number of states under the four different definitions over the past 12 months. This analysis did not look at all the states, but instead focused on those states to which identified CaliFormer businesses have moved recently. In the table, a blue cell indicates the state performed better under that definition than California. A red cell indicates they did worse.
Change in Employment: September 2019 to September 2020
Source: Quarterly Census of Employment & Wages
Data in the table is from the recently released Quarterly Census of Employment & Wages for the 3rd quarter of 2020. This data source provides a full accounting of wage and salary jobs and wages from employment tax filings, as opposed to the monthly estimates reported below that are based on surveys and modeling. This data does not include self-employment and non-wage employment, but provides a more accurate and detailed-level basis for analysis.
The 3rd quarter results also provide the first instance where the data starts to capture any interstate moves by businesses or workers. This effect is likely small given that the results are still only 7 months into the pandemic and the fact that actual employment changes generally lag announced moves by several months if not more than a year.
From those perspectives, the results likely illustrate more the growth in competing tech centers that was occurring even before the pandemic, and the base which will compete for tech businesses and tech workers in the future.
From the results, Colorado, Florida, Georgia, Tennessee, Utah, and Virginia performed better than or matched California under all four measures. This outcome is generally consistent with the findings from the recent studies cited earlier that tech workers are favoring the smaller emerging tech centers.
Results for Idaho, Massachusetts, North Carolina, South Dakota, Texas, and Washington are more mixed. These states outperformed or matched California under only 2-3 of the definitions. The rankings for Texas, however, were affected by the performance of the oil and gas-related industries in this period, including the direct industries and chemical manufacturing under the BLS and Brookings definitions. Under the more typical tech definitions from Milken and the Center’s, Texas did better.
California outperformed New York and Oregon. These states did better than California only under one of the definitions.
In using this data, additional issues need to be kept in mind. The NAICS code for each establishment is based on its primary activities. Additional business activities are consequently captured under that single code rather than distributed as indicated in the different definitions. Similarly, a California business may relocate one of its units or operations, and if operated as a separate establishment in a new state is classified based on its activity. For example, a high-tech business may move or start a call center in South Dakota, and that establishment would have that NAICS classification—which is not in any of the definitions—rather than the NAICS for the headquarters business.
Finally, the Quarterly Census of Employment & Wages is not set up to handle telecommuting well. Employment counts are based on where the office is based; not where the workers live. Consequently, while these indicators do well in tracking where tech businesses are moving and expanding—at least on this aggregated level that does not allow a complete separation of these sources—other data including population and after a substantial time-lag, commuting information from this data source must be used to address these issues. The recent series of cited reports are beginning to help flesh out this component if only with early data results. More complete analysis, however, likely will still require sources such as the American Community Surveys beginning with the results to be released in late 2022.
Employment: 1.599 Million Below Recovery
EDD reported that employment (seasonally adjusted; January preliminary) grew 31,800 from the revised December numbers, while the number of unemployed dropped 68,400. The reported unemployment rate dipped 0.3 points to 9.0%. The unadjusted rate was 4.7 points worse than the year earlier at 9.2%.
California’s situation relative to the rest of the states weakened, rising to the 2nd highest unemployment rate. Unemployment rates in the other states were as low as 3.1% in South Dakota and Utah.
Total US employment gained 201,000. The number of unemployed dropped by 606,000. The reported unemployment rate improved 0.4 points to 6.3%.
Figure Sources: California Employment Development Department; US Bureau of Labor Statistics
Compared to the February 2020 numbers (seasonally adjusted) just prior to the current crisis and not accounting for population changes, the employment shortfall in California rose to 1.599 million.
Labor Force Participation Rate Drops to 60.0%
The revised labor force data indicates labor force participation weakened more than previously estimated, with California’s seasonally adjusted labor force participation rate in January dropping to 60.0%. Nationally, the participation rate was 61.4%. The difference between national and state numbers alone translates into a labor force shortfall of 435,000 for the state. The 2.8% drop in the state participation rate since pre-COVID February 2020 translates into an additional 871,000 workers no longer employed but not counted in the unemployment numbers.
For the 12 months ending January 2020, the seasonally adjusted data shows the California labor force was down 768,100 workers (-4.0% loss) compared to the rest of the US loss of 3,525,400 (-2.4%). This difference indicates that on average, the COVID policies in other states have been more successful in keeping workers engaged in the labor force.
Employment Growth Ranking
The total number of persons employed (seasonally adjusted) over the 12 months ending in January was down 1,624,400. California had the lowest level among the states in terms of absolute employment loss over the year.
Adjusted to account for differences in the size of each state economy, California over the year showed an 8.7% contraction, worse than the rest of the US with a loss of 5.0%. Ranked among the states, California dropped to the 3rd worst loss rate. California with 12% of the population accounted for 23% of total employment losses.
Figure Source: US Bureau of Labor Statistics
Nonfarm Jobs: 1.793 Million Below Recovery
Nonfarm jobs (seasonally adjusted) dropped 69,900 in January, compared to the revised losses in December at 75,400.
Nonfarm jobs were down 1,752,800 over the year. Adjusting for population, California’s loss rate dropped to 48th among the states. The 12-month jobs loss rate was -9.9% compared to the rest of the US at -5.8%. California accounted for 22% of total job losses.
Figure Sources: California Employment Development
Department; US Bureau of Labor Statistics
Compared to the February 2020 numbers (seasonally adjusted) just prior to the current crisis and not accounting for population changes, nonfarm wage and salary jobs in California dropped to 1.793 million short of recovery.
Jobs Change by Industry
Using the unadjusted numbers that allow a more detailed look at industry shifts, all but three industries show contractions in the 12-month period ending in January. Industries showing the greatest contractions over the year were led by Food Services, Government, and Arts, Entertainment & Recreation. As schools remained closed through this period, losses in Government were dominated by Local Education (down 128,600).
| Not Seasonally Adjusted Payroll Jobs (1,000) | January 2020 | 12-month change | Nonfarm Growth Rank | % 12-month Change | Avg. Annual Wage |
|---|---|---|---|---|---|
| Total Farm | 351.9 | 0.6 | 0.2% | $37.4k | |
| Mining & Logging | 18.5 | -3.0 | 3 | -14.0% | $111.7k |
| Construction | 851.8 | -24.3 | 7 | -2.8% | $74.1k |
| Manufacturing | 1,229.8 | -82.8 | 14 | -6.3% | $101.0k |
| Wholesale Trade | 633.6 | -48.9 | 10 | -7.2% | $82.4k |
| Retail Trade | 1,566.3 | -83.6 | 15 | -5.1% | $39.5k |
| Utilities | 59.3 | 2.0 | 2 | 3.5% | $142.5k |
| Transportation & Warehousing | 697.7 | 18.7 | 1 | 2.8% | $61.6k |
| Information | 520.4 | -59.0 | 11 | -10.2% | $199.8k |
| Finance & Insurance | 534.2 | -6.1 | 4 | -1.1% | $140.1k |
| Real Estate & Rental & Leasing | 273.6 | -29.3 | 8 | -9.7% | $74.8k |
| Professional, Scientific & Technical Services | 1,305.3 | -37.8 | 9 | -2.8% | $131.2k |
| Management of Companies & Enterprises | 239.2 | -14.9 | 5 | -5.9% | $138.9k |
| Administrative & Support & Waste Services | 1,043.0 | -86.8 | 16 | -7.7% | $49.7k |
| Educational Services | 322.3 | -59.9 | 13 | -15.7% | $58.6k |
| Health Care | 1,547.6 | -59.0 | 11 | -2.4% | $71.3k |
| Social Assistance | 844.8 | -17.0 | 6 | -2.0% | $22.1k |
| Arts, Entertainment & Recreation | 159.3 | -164.3 | 19 | -50.8% | $66.2k |
| Accommodation | 107.9 | -128.3 | 17 | -54.3% | $41.3k |
| Food Services | 947.9 | -496.0 | 21 | -34.4% | $24.5k |
| Other Services | 430.8 | -147.9 | 18 | -25.6% | $44.0k |
| Government | 2,412.5 | -207.8 | 20 | -7.9% | $74.8k |
| Total Nonfarm | 15,745.8 | -1,736.0 | -9.9% | ||
| Total Wage & Salary | 16,097.7 | -1,735.4 | -9.7% | ||
Figure Source: California Employment Development Department;
Wages based on most recent Quarterly Census of Employment & Wages
Unemployment Rates by Region (not seasonally adjusted)
Unemployment rates continued to reflect the regional mix of jobs that have been retained through telework compared to relative shares of lower-wage services and tourism jobs that have been hit the hardest by the state-ordered closures and other restrictions.
| wdt_ID | Region | Unemployment Rates |
|---|---|---|
| 2 | California | 9.2 |
| 6 | Bay Area | 6.6 |
| 10 | Orange County | 7.4 |
| 14 | Sacramento | 7.5 |
| 18 | Central Sierra | 8.3 |
| 22 | San Diego/Imperial | 8.4 |
| 26 | Upstate California | 8.6 |
| 30 | Inland Empire | 8.6 |
| 34 | Central Coast | 9.2 |
| 38 | Central Valley | 10.3 |
| 39 | Los Angeles | 12.2 |
Figure Source: California Employment Development Department
How Far Back Has the Economy in Each County Been Pushed?
As an indication of the severity of the current economic downturn, the following chart illustrates how much economic ground each county has lost using employment levels as the measure. Based on annual averages, the chart below indicates the last year each county saw the January employment numbers. Because the current series only goes back to 1990 for most counties, several of the entries indicate “Before 1990.” Los Angeles County is the exception, with data going back to 1976. The “Change” column indicates the change from April, the month reflecting the effects of the initial round of closures.
| wdt_ID | County | Last Year Employment Equal To or Less Than April 2020 | Last Year Employment Equal to or Less Than January 2021 |
|---|---|---|---|
| 2 | Alameda County | 2009 | 2013 |
| 3 | Alpine County | 2009 | 2018 |
| 4 | Amador County | 1997 | 2013 |
| 5 | Butte County | 1998 | 1999 |
| 6 | Calaveras County | 2012 | 2014 |
| 7 | Colusa County | 1999 | 2003 |
| 8 | Contra Costa County | 1997 | 2013 |
| 9 | Del Norte County | 1992 | 1993 |
| 10 | El Dorado County | 1999 | 2016 |
| 11 | Fresno County | 2012 | 2015 |
| County | Last Year Employment Equal To or Less Than April 2020 | Last Year Employment Equal to or Less Than January 2021 |
MSAs with the Worst Unemployment Rates: Los Angeles 23rd Worst in Nation
California had just over half of the MSAs among the 25 regions with the worst unemployment rates in December. As a result of a pattern of job growth in recent years that concentrated on the hardest-hit lower wage, population-serving and tourism service industries in Los Angeles County, Los Angeles-Long Beach-Anaheim MSA (Los Angeles and Orange Counties) tied with Madera and Modesto MSAs for the 23rd worst in the nation.
| wdt_ID | MSA | December Unemployment Rate | US Rank out of 389 |
|---|---|---|---|
| 1 | El Centro MSA | 17.7 | 389 |
| 2 | Visalia-Porterville MSA | 11.8 | 385 |
| 3 | Merced MSA | 11.5 | 381 |
| 4 | Salinas MSA | 11.4 | 380 |
| 5 | Bakersfield MSA | 11.3 | 378 |
| 6 | Hanford-Corcoran MSA | 11.0 | 376 |
| 7 | Yuba City MSA | 10.7 | 375 |
| 8 | Stockton-Lodi MSA | 10.6 | 374 |
| 9 | Fresno MSA | 10.4 | 372 |
| 10 | Los Angeles-Long Beach-Anaheim MSA | 9.9 | 367 |
| 11 | Modesto MSA | 9.9 | 367 |
| 12 | Madera MSA | 9.9 | 367 |
| 13 | Riverside-San Bernardino-Ontario MSA (tie) | 9.1 | 364 |