Highlights for policy makers:
- Unemployment Rate Declines to 6.3%; Total Employment Climbs 35,000
- State Employment Growth Rankings
- Labor Force Participation Rate Remains at 62.5%
- Nonfarm Jobs Increase 22,900
- 7 Industries Remain Below 2007 Pre-Recession Job Levels
- 6 Counties Remain in Double-Digit Unemployment, Down from 7 in May
- Two-Tier Economy Persists
Unemployment Rate Declines to 6.3%; Total Employment Climbs 35,000
The Labor Force data for June 2015 (seasonally adjusted; California preliminary) is shown below, along with the change from the prior month:
The related not seasonally adjusted numbers (California preliminary), with the change from June 2014
California Employment Development Department’s (EDD) latest release shows on a seasonally adjusted basis, total employment grew 35,000 from May, while the number of unemployed dropped by 18,600. California’s seasonally adjusted unemployment rate declined from 6.4% in May to 6.3% in June. The unadjusted rate decreased from 7.4% in June 2014 to 6.2% in June 2015.
Total US employment was essentially unchanged (seasonally adjusted increase of 56,000), while the number of unemployed dropped at a higher rate (seasonally adjusted decline of 375,000).
California’s labor force participation remained level at 62.5%, and due to the steep drop in the US rate, neared the national average for the first time since 2009
State Employment Growth Rankings
California’s seasonally adjusted unemployment rate was 16% higher than the national rate. California’s ranking worsened slightly to be the 9th highest unemployment rate among the states (including DC).
Between June 2014 and June 2015, Bureau of Labor Statistics (BLS) data shows the total number of employed in California increased by 482,404 (seasonally adjusted), or 17.8% of the total net employment gains in this period for the US. Measures that adjust for size will generally give a better ranking based on economic performance.
Measured by total employment gains, California continued to be highest among the states. Measured by percentage change in employment over the year, California was 15th. Adjusted for population, California was the 16th highest. Taken together, these rankings suggest that while California continues to improve its employment growth overall, it still is underperforming relative to its size. While California now exceeds the pre-recession employment highs and is technically in an expansion period, employment gains have yet to match population growth since the recession. The state continues to fall short of this measure of recovery.
Labor Force Participation Rate Remains at 62.5%
California’s participation rate (seasonally adjusted) remained unchanged at 62.5%, returning to the marginal gains seen last fall. The comparable US rate showed a steep drop to 62.6%. While California’s rate is now nearing the national average, the overall level remains at rates previously seen in 1976.
Nonfarm Jobs Increase 22,900
EDD reported that between May and June 2015, seasonally adjusted nonfarm payroll jobs increased by 22,900. The May job gains were revised downwards from the preliminary estimate of 54,200 to 46,200.
Looking at the not seasonally adjusted numbers, the change in nonfarm payroll jobs from May 2015 saw the largest increases in Manufacturing (11,900), Retail Trade (10,600), and Professional, Scientific & Technical Services (9,400). As school began letting out for summer, declines were felt in Educational Services (-13,900) and Government (-13,400) and in Management of Companies & Enterprises (-200).
By total number of new jobs, California had the highest increase in seasonally adjusted nonfarm jobs among the states from June 2014 to June 2015, at 461,900 or 16.8 % of the US total. By percentage growth in jobs, California was the 6th highest; and by population adjusted jobs growth, 8th highest.
civilian noninstitutional population)
7 Industries Remain Below 2007 Pre-Recession Job Levels
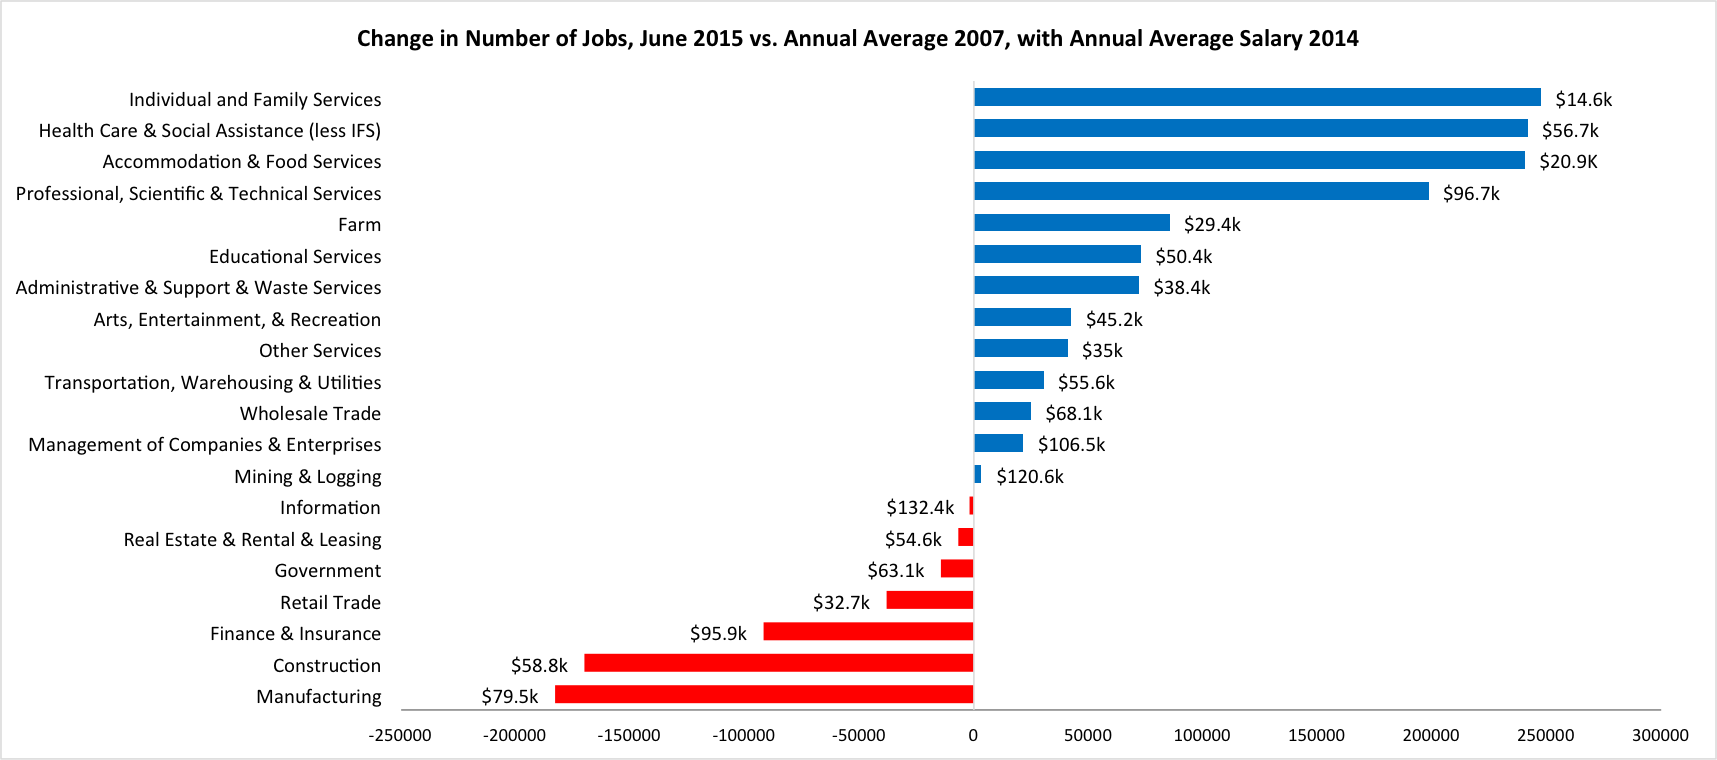
Comparing the number of jobs by industry in June 2015 (not seasonally adjusted), 7 industries remain below the 2007 pre-recession levels.
As indicated in the figure above, growth continues to be primarily in the lower wage and higher wage industries, with two of the top three growth industries paying well under $2,000 a month in average wages. The largest gaps remain in the middle class-wage industries of Manufacturing and Construction. However, the higher-wage Finance & Insurance continues to exhibit sustained and more significant declines.
6 Counties Remain in Double-Digit Unemployment, Down from 7 in May

Two-Tier Economy Persists
Unemployment rates (all data is not seasonally adjusted) continue to vary widely across the state, ranging from 4.2% in the Bay Area to more than double at 9.8 in the Central Valley.
Ratio of Highest to Lowest Rate: 2.30
By County:
Ratio of Highest to Lowest Rate: 6.39
Note: All data sources, methodologies, and historical data series available at CenterforJobs.org.