Highlights for policy makers:
- COVID-19 and the State Economy
- Employment: 1.245 Million Below Recovery
- Labor Force Participation Rate Dips to 60.8%
- Employment Growth Ranking
- Nonfarm Jobs: 1.471 Million Below Recovery
- Jobs Change by Industry
- Employment Recovery by Region
- Unemployment Rates by Legislative Districts
- Unemployment Rates by Region
- How Far Back Has the Economy in Each County Been Pushed?
- MSAs with the Worst Unemployment Rates: Los Angeles 8th Worst in Nation
COVID-19 and the State Economy
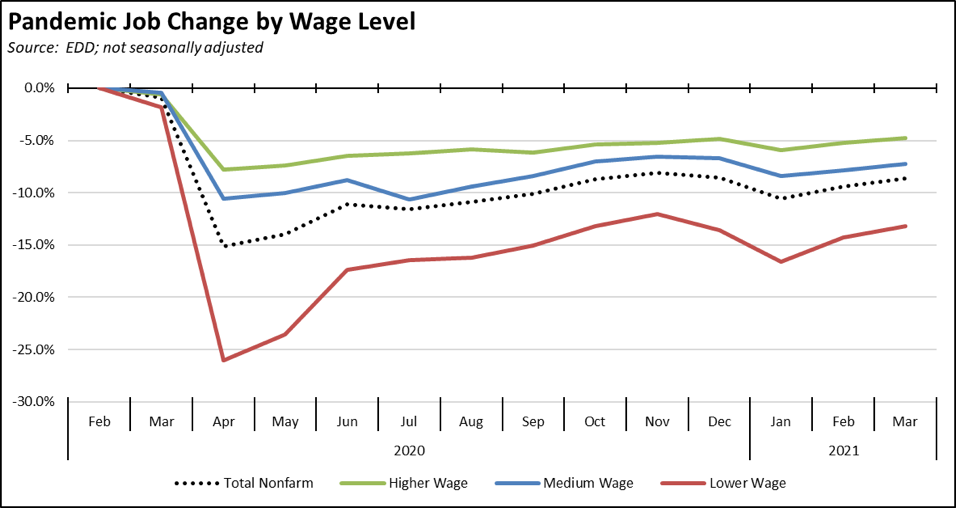
The March numbers are based on surveys done during a week when 34 counties were still under the state’s Tier 1 restrictions. Consequently, jobs growth by industry wage level still shows substantially higher effects on the lower wage industries that were affected the most by the state’s approach in dealing with the pandemic. The April surveys—done when only 2 counties remained under Tier 1—will provide a better picture of the initial steps in the state towards recovery.
Job growth was seen across all three wage levels. While the lower wage industries again experienced somewhat higher growth, their overall recovery status remains the lowest. The higher wage industries basically returned to their prior peak just before the state’s stay-at-home orders at the end of last year; the other two wage groups remain somewhat below. The relatively good job numbers over the past two months consequently do not necessarily show new progress in the recovery, but more indicate regaining lost ground coming from those state actions in late 2020.
In the chart, higher wage jobs are those industries with average annual wages above $100,000; medium wage is $50,000 to $100,000; and lower wage is below $50,000. Job data is drawn from the industry classifications, unadjusted job numbers, and wage levels shown in the regular report section below on Nonfarm Jobs.
Trend is Not Enough
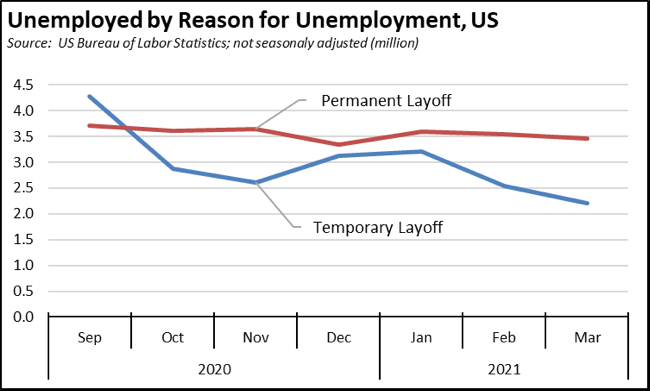
Still, the overall trend since January has been positive, if only in recovering ground lost at the end of the year. But as recently stated by former Obama economic advisor Jason Furman, “trend is not enough.” Looking at the national labor force numbers that allow a more statistically valid comparison by month:
- After an increase in December as some other states followed California’s lock down orders, the number of unemployed on temporary layoff dropped 1.013 million over the past 2 months. The number of unemployed on permanent layoff instead has remained largely unchanged. This aspect again indicates that the positive trend of the last two months reflects recovered lost ground as the most recently unemployed were brought back to work rather than pushing the recovery forward over a broader range of workers.
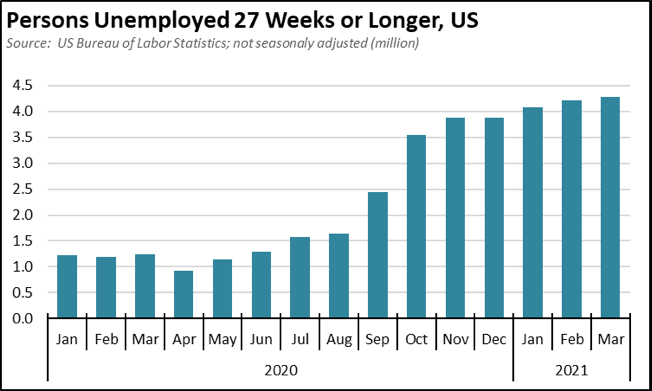
- At the same time, the number of persons who have been unemployed for more than 6 months has steadily increased since last April, recreating the challenges to long-term wage and income growth experienced during the shallow and lengthy recovery from the 2008 recession. Again, the numbers in both these points reflect workers who have remained in the labor force and do not include those who are unemployed but no longer looking for work.
- In the broader trends referenced by Furman, the economic peak in February 2020 just prior to the current downturn still saw some demographic groups short of recovery from the previous recession that began in 2008. Full employment had been reached only in a statistical sense when looking at workers in the labor force, but many workers still remained on the sidelines as reflected in the lower participation rate, a trend that has been more pronounced in California than the rest of the US. Comparing the February 2020 levels to the pre-financial crisis employment peak in November 2007, youth employment was well below recovery levels, while prime working age men were short of the mark as well.
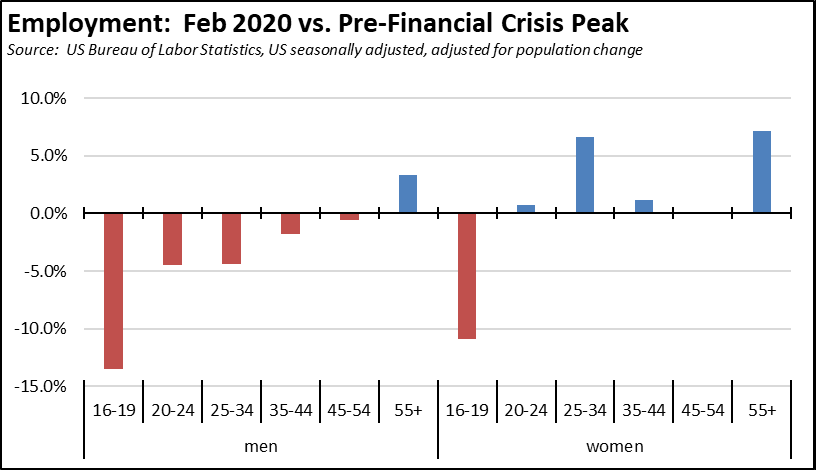
In the chart, the comparison for each group is taken as the peak employment level in 2007. In a few cases, the peak instead came during the first quarter of 2008, but the differences are minor. Two other factors are of more significance. First, construction began significant declines the year earlier, affecting the 2007 levels somewhat more for men. Second, employment growth for women age 55 and older was essentially continuous in this period. While men in this age group experienced a short duration employment dip in 2008, employment for women age 55 and older continued to grow and never reached a “peak” until the current crisis. - This situation has largely been upended by the pandemic strategies taken by California and other states. Employment and wages have been affected by two key elements: (1) business closures that saw the greatest loss among lower wage occupations and (2) continued uncertainty over school openings—with decisions made in some cases at the last minute—forcing many workers with child care responsibilities to make difficult choices. For higher incomes, both elements have been mitigated to a large extent by the rapid shift to telecommuting, with childcare responsibilities coming from the second element shared more equally by mothers and fathers leaving the labor force. For lower incomes, the effects have been compounded especially for women, with their jobs eliminated and the ability to search for a replacement precluded by the closed schools. In a recent analysis, lower income mothers showed a far more profound effect from this situation, experiencing a 9% drop in labor force participation between February and December 2020.
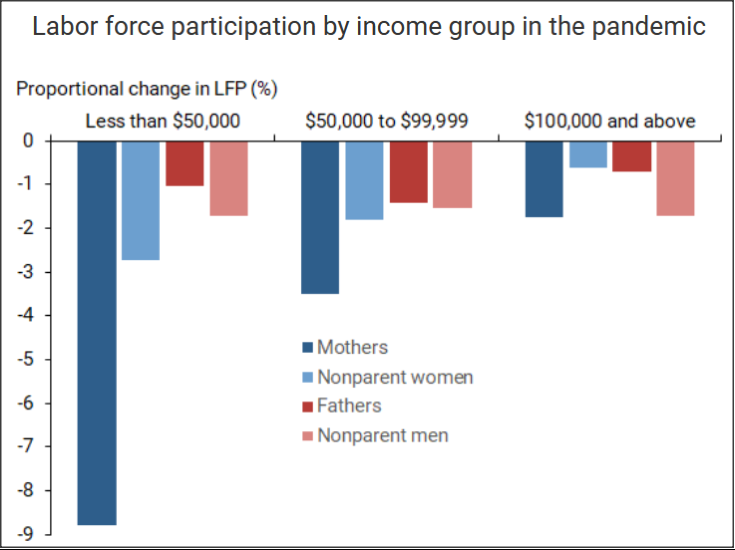
Source: Olivia Lofton, Nicolas Petrosky-Nadeau, and Lily Seitelman, Parental Participation in a Pandemic Labor Market,
Federal Reserve Bank of San Francisco, Economic Letter, April 5, 2021
Trend Moving Forward
The concept of recovery equity has been used throughout the state’s response to the pandemic, but as expressed during the recent signing of SB 93, the concept as applied has been more on dividing up what is there—an economy defined by return to trend—rather than addressing more fundamental causes.
The labor force participation factors discussed above have been more pronounced in California (see Labor Force Participation Rate section below), with the drop beginning in 2008 deeper here even though the state still has a relatively younger population than the rest of the nation. A key element in this situation has been the educational skills of the labor force, both attainment levels for current workers and the skills being developed by the schools for the future.
After a few years engaged in a tie with Texas for the lead spot, California since 2013 has led the nation in the share of adults (age 25 and older) with less than a high school diploma or equivalent. While the number has eased over the years, 16.0% of adults were at this educational attainment level in 2019. In the past, this aspect in itself was not a barrier to jobs paying even middle class level wages, but the trend in California beginning with the 2008 recession recovery has been towards a two-tier economy. As detailed by the Center in several reports, the trend in employment has been heavily concentrated at the extremes of the wage scale, with higher wage jobs especially in the tech industries and lower wage jobs in population serving and tourism related services.
The missing element has been the middle, especially higher wage blue collar jobs—other than trade and logistics—that historically supported middle class incomes. These are the industries that have been the most affected by state policies such as those producing soaring energy prices, and these are the workers who are heavily affected by continuously rising costs of living that swamp whatever wage progress they are able to achieve. Simply detailing access to lower wage jobs does not overcome the unequal outcomes already built into this trend, and this trend cannot be reversed given the size of this skills cohort without a reassessment of state policies that limit a broader range of wage opportunities.
As discussed above, school closures and just as critically continued uncertainty over if, when, and how they will reopen has been a significant contributor to unequal outcomes during the current economic downturn, especially lower income women. The consequent effect on students as well is yet to be known for the long term, but early results show reduced progress in core subjects such as math and increasing numbers of students especially those from lower income households who have become disengaged from the schools.
In this case as well, simply reopening the schools—with certainty that enables parents to return to jobs—as the return to trend does not address the core problems already built into the state’s educational system.
Since 2011-12, LAO indicates total state funding for the K-12 schools has increased substantially, with the 2021-22 proposed spending level showing an increase of $24.3 billion to $61.2 billion, or a 67% rise over the ten years. Total K-12 funding from all sources is shown at $104.9 billion, an increase of 63%. The numbers in the final budget bill are likely to be higher, and will include additional federal funds from the last two COVID assistance bills as well as additional Prop 98 funds as a result of general fund revenues running well above the January projections, most recently through March at $17 billion higher.
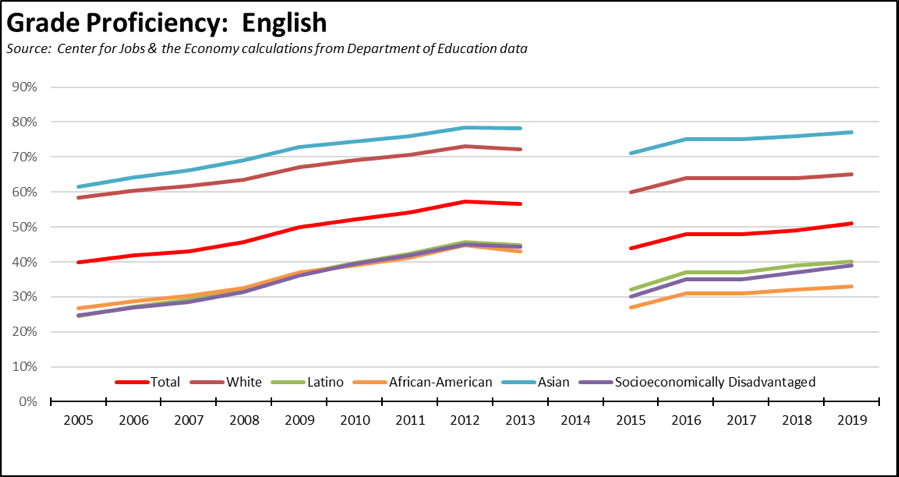
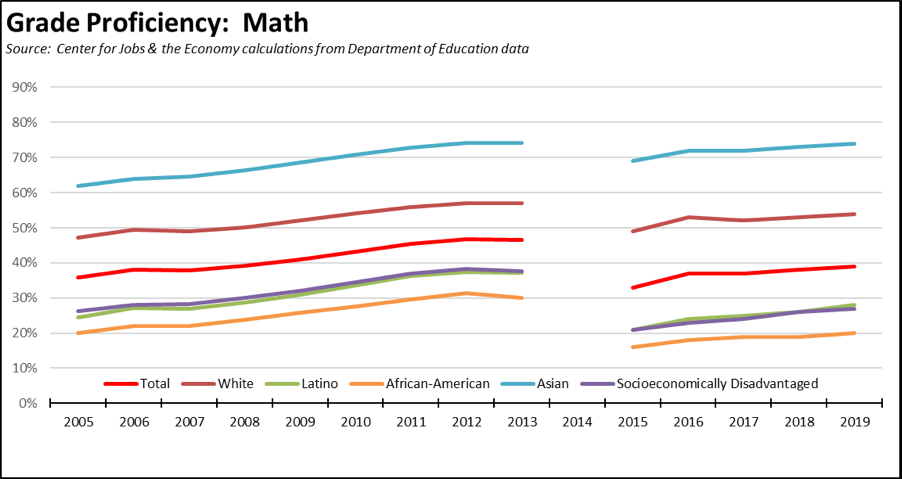
Combined with these increases, state funding has also shifted to socioeconomically disadvantaged students under the Local Control Financing Formula (LCFF), although the absence of accountability provisions means funds are allocated on this basis, but do not have to be spent for this purpose. In spite of these changes, persistent gaps in educational outcomes remain, as indicated in the following charts showing the percentage of students by demographic testing at proficient or above for grade level for both English and Math. Note that testing was not done in 2014 or 2020, and the test changed in 2015.
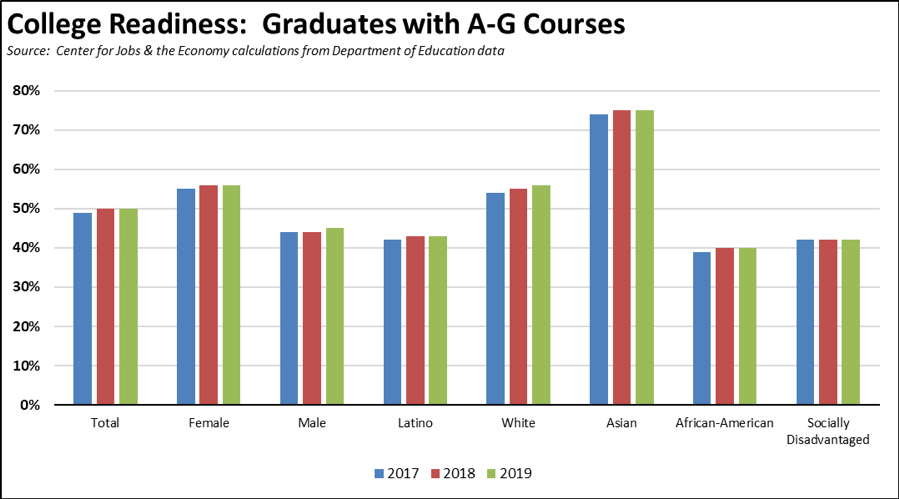
The state has also attempted to address income opportunities by increasing access to the college degrees essential for the higher wage jobs California is now creating. However, comparable gaps also remain in the schools’ preparation of students to take advantage of these options, as indicated in the following chart showing the percentage of high school graduates completing the A-G coursework required for applications to UC and CSU. In addition to the gaps by race and ethnicity, there is also a persistent gap in outcomes for boys and girls, with starker outcomes for Latino and African-American boys.
Finally, there is also considerable variance in the outcomes by area, as indicated in the following tables showing the highest and lowest performance in 2019 by legislative district. Full district results are available on the Center’s website which also contains the results by county and region and additional data on drop-out rates.
English Proficiency, 2019
Source: California Center for Jobs & the Economy Calculations from Department of Education Data
Math Proficiency, 2019
Source: California Center for Jobs & the Economy Calculations from Department of Education Data
College Preparation, 2019
Source: California Center for Jobs & the Economy Calculations from Department of Education Data
Funding for the schools is also projected to continue its rise over at least the next few years, both as state general fund and local property tax revenues grow and on a per-pupil basis as K-12 enrollment continues to decline. These additional revenues, however, will be allocated primarily to pay off past pension debt rather than improving student outcomes. The following chart shows the projections from the January proposed budget numbers, with the cumulative change in State payments under Prop 98 taken from Department of Finance Multi-year Projections, and the District pension payment from LAO EdBudget figures. Both sources cover both K-12 and community college districts.
The outcome is that while the January projections show state schools funding rising another $4 billion over the next few years—an amount greater than what would have been provided under last year’s Prop 15—most of this amount will cover accumulated pension debt. Only about a quarter will be available for classroom and other uses.
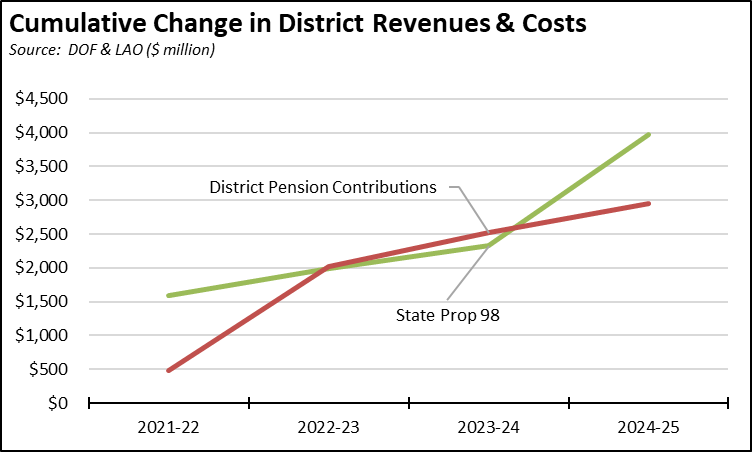
This chart is based on the January estimates and consequently does not incorporate additional one-time federal funds or ongoing Prop 98 increases coming from the rising general fund revenues.
The chart also does not include the one-time $2.31 billion payment to schools contained in the January proposal. This amount comes from budget trailer bill language from last year that would have gradually increased the state’s commitment under Prop 98 from about 38% of general fund to 40% under Test 1 years. The January budget instead proposes to cut future schools funding by eliminating this provision, but still includes the scheduled 2021-22 amount as a one-time supplemental payment.
CaliFormer Businesses: Update
Additional CaliFormer companies identified since our last monthly report are as follows. These companies include those that have announced: (1) moving their headquarters or full operations out of state, (2) moving business units out of state (generally back office operations where the employees do not have to be in a more costly California location to do their jobs), (3) California companies that expanded out of state, and (4) companies turning to permanent telework options, leaving it to their employees to decide where to work and live.
CaliFormers Update
| wdt_ID | Companies | From | To | Reason | Source | Year |
|---|---|---|---|---|---|---|
| 2 | Abzena | San Diego | North Carolina | Manufacturing expansion | Read More | 2021 |
| 3 | Alphatec Spince | Carlsbad | Memphis | Distribution/repair facility expansion | Read More | 2021 |
| 4 | Bioness | Valencia | North Carolina | HQ move--acquired by Bioventus | Read More | 2021 |
| 5 | Cloudfire | San Francisco | Telework | Subleasing entire building | Read More | 2021 |
| 6 | Colony Capital | Los Angeles | Florida | HQ move | Read More | 2021 |
| 7 | Cryoport | Irvine | Nashville | HQ move | Read More | 2021 |
| 8 | Flannery Trim | San Fernando | Dallas | HQ and distribution center move | Read More | 2021 |
| 9 | GoCheck Kids | San Francisco | Nashville | HQ move | Read More | 2018 |
| 10 | Guardian Bikes | Irvine | Austin | HQ move | Read More | 2020 |
| 11 | i2c Inc. | Redwood City | San Antonio | Expansion | Read More | 2021 |
| Companies | From | To | Reason | Source | Year |
Additional high income taxpayers moving out of the state include the following:
| wdt_ID | High-Income Taxpayers | Company | To | Source | Year |
|---|---|---|---|---|---|
| 2 | Al Kelly (no indication if primary residence) | Visa | Florida | Read More | 2021 |
Employment: 1.245 Million Below Recovery
EDD reported that employment (seasonally adjusted; March preliminary) grew 9,900 from the revised February numbers, while the number of unemployed dropped 49,600.
The official number of unemployed, however, counts only those remaining within the labor force and looking for work. Comparing employment and unemployment to pre-pandemic February 2020 numbers, there are another 530,000 California workers who left the workforce in this period. This component instead puts the total number of those out of work in the current crisis at 2.090 million.
The reported unemployment rate dipped 0.2 point to 8.3%. This improvement, however, was almost solely a statistical result coming from the drop in the labor force number. The unadjusted rate was 3.1 points worse than the year earlier at 8.2%.
California’s situation relative to the rest of the states was unchanged, tying with Connecticut and New Mexico for the 3rd highest unemployment rate. Only Hawaii and New York were worse. Unemployment rates in the other states were as low as 2.9% in Nebraska, South Dakota, Utah, and Vermont.
Total US employment gained 609,000, while the number of unemployed dropped by 262,000. The reported unemployment rate improved 0.2 point to 6.0%.
Figure Sources: California Employment Development Department; US Bureau of Labor Statistics
Compared to the February 2020 numbers (seasonally adjusted) just prior to the current crisis and not accounting for population changes, the employment shortfall in California was only marginally improved to 1.245 million below recovery.
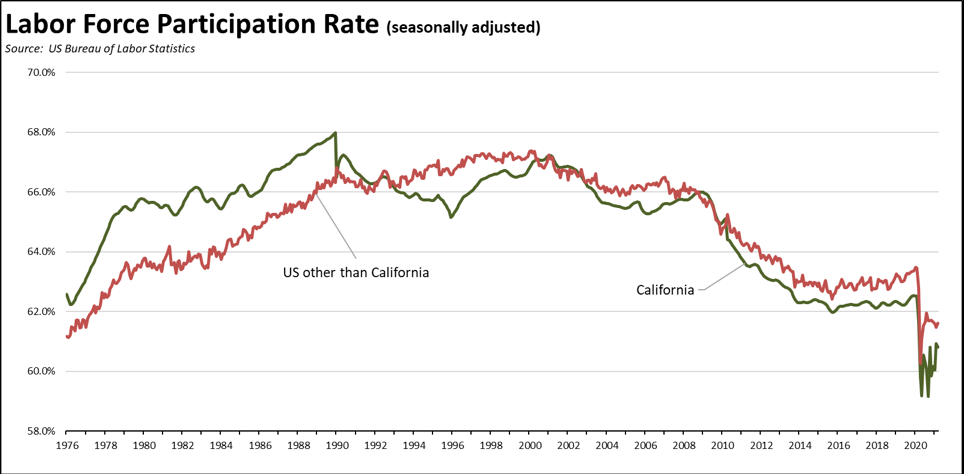
Labor Force Participation Rate Dips to 60.8%
The March numbers saw the labor force participation rate dip 0.1 percentage point to 60.8%, while the US number rose the same amount to 61.5%. The rate remains well below the pre-pandemic level of 62.5%, which in turn was down substantially from prior years. Even with a relatively younger population than other states, California’s labor force recovery lagged the rest of the nation during the previous economic recovery period. Compared to the previous near-term high in 2008, there is an overall shortfall of 1.6 million workers outside the labor force who otherwise could form the base for future economic growth and support for the state budget’s fiscal needs. Compared to the prior peak in 2000, the gap is 2.1 million workers. The state’s policies, however, continue to emphasize relief for those outside the labor force rather than reforms to promote jobs and entrepreneurship to build from this underutilized resource.
Employment Growth Ranking
The total number of persons employed (seasonally adjusted) over the 12 months ending in March was down 962,000. Six states (Colorado, Idaho, Kansas, North Carolina, Oklahoma, South Dakota) showed gains in this period.
Adjusted to account for differences in the size of each state economy, California over the year showed a 5.3% contraction, worse than the rest of the US with a loss of 2.9%. Ranked among the states, California rose only slightly to the 14th worst loss rate. California with 12% of the population accounted for 20% of total net employment losses.
Figure Source: US Bureau of Labor Statistics
Nonfarm Jobs: 1.471 Million Below Recovery
Nonfarm wage and salary jobs rose 119,600 (seasonally adjusted) in March, while the gains in February were revised to 156,100 from the previously reported 141,000.
The seasonally adjusted number puts nonfarm jobs above the previous recovery peak reached in November 2020, with the higher jobs growth in the past two months regaining ground lost following the state’s stay-at-home orders at the end of last year. As indicated previously, the unadjusted numbers still show nonfarm jobs 100,000 below the November peak.
Nonfarm jobs were down 1,350,500 over the year. Adjusting for population, California’s loss rate was marginally improved to 47th among the states. The 12-month jobs loss rate was -7.7% compared to the rest of the US at -4.0%. California accounted for 20% of total net job losses. Two states (Idaho, Utah) showed positive job gains in this period.
Figure Sources: California Employment Development
Department; US Bureau of Labor Statistics
Compared to the February 2020 numbers (seasonally adjusted) just prior to the current crisis and not accounting for population changes, nonfarm wage and salary jobs in California dropped to 1.471 million short of recovery.
Jobs Change by Industry
Using the unadjusted numbers that allow a more detailed look at industry shifts, all but three industries show contractions in the 12-month period ending in March. Industries showing the greatest contractions over the year were again led by Food Services, Government, and Arts, Entertainment & Recreation. As many schools remained closed through this period, losses in Government were dominated by Local Education (down 137,600).
Figure Source: California Employment Development Department;
Wages based on most recent Quarterly Census of Employment & Wages
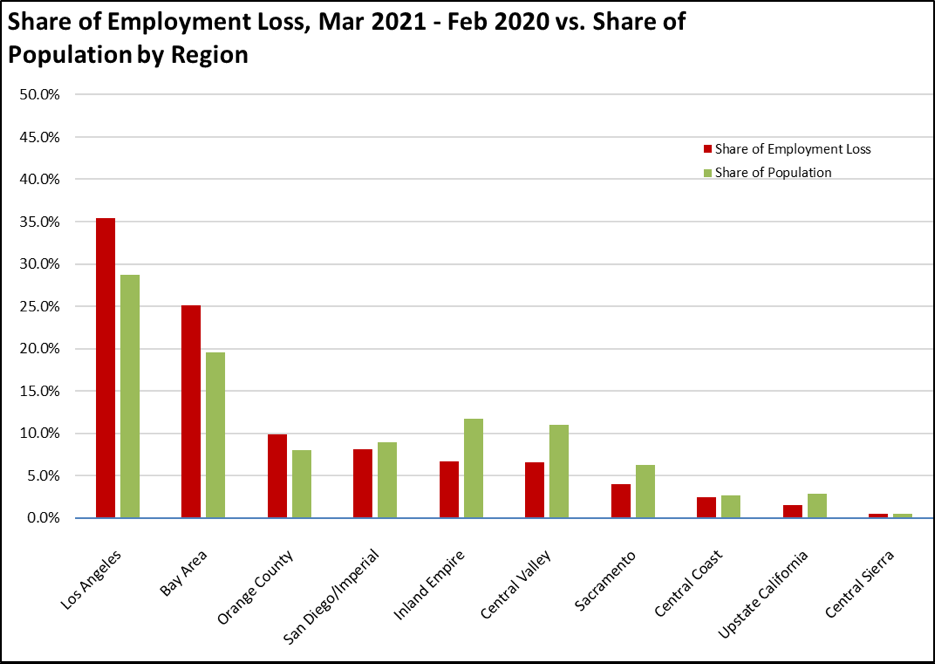
Employment Recovery by Region
In part reflecting the annual data revisions released by EDD, both the Los Angeles and Bay Area regions contained a higher share of employment losses (since pre-pandemic February 2020) relative to their populations.
Unemployment Rates by Legislative Districts
The highest and lowest estimated unemployment rates in March are shown below. The legislative district estimates have been updated to reflect both EDD’s revisions to the unemployment data and the most current factors from the American Community Survey.
Lowest
| wdt_ID | Congressional District | Unemployment Rate |
|---|---|---|
| 2 | CD18 (Eshoo-D) | 4.2 |
| 3 | CD17 (Khanna-D) | 5.1 |
| 4 | CD15 (Swalwell-D) | 5.4 |
| 5 | CD52 (Peters-D) | 5.3 |
| 6 | CD14 (Speier-D) | 5.4 |
| 7 | CD12 (Pelosi-D) | 5.3 |
| 9 | CD49 (Levin-D) | 5.6 |
| 10 | CD02 (Huffman-D) | 5.8 |
| 12 | CD45 (Porter-D) | 5.8 |
| 13 | CD19 (Lofgren-D) | 5.9 |
| wdt_ID | Senate District | Unemployment Rate |
|---|---|---|
| 2 | SD13 (Hill-D) | 4.6 |
| 3 | SD15 (Beall-D) | 5.3 |
| 4 | SD10 (Wieckowski-D) | 5.5 |
| 5 | SD39 (Atkins-D) | 5.5 |
| 6 | SD36 (Bates-R) | 5.6 |
| 7 | SD01 (Dahle-R) | 6.2 |
| 8 | SD11 (Wiener-D) | 5.6 |
| 9 | SD37 (Moorlach-R) | 5.9 |
| 10 | SD02 (McGuire-D) | 6.1 |
| 11 | SD07 (Glazer-D) | 6.3 |
| wdt_ID | Assembly District | Unemployment Rate |
|---|---|---|
| 2 | AD28 (Low-D) | 4.2 |
| 3 | AD24 (Berman-D) | 4.6 |
| 4 | AD16 (Bauer-Kahan-D) | 4.6 |
| 5 | AD22 (Mullin-D) | 4.6 |
| 6 | AD73 (Brough-R) | 5.4 |
| 7 | AD78 (Gloria-D) | 5.3 |
| 8 | AD25 (Chu-D) | 5.2 |
| 9 | AD06 (Kiley-R) | 5.2 |
| 10 | AD17 (Chiu-D) | 5.4 |
| 11 | AD77 (Maienschein-R) | 5.5 |
Highest
| wdt_ID | Congressional District | Unemployment Rate |
|---|---|---|
| 2 | CD29 (Cardenas-D) | 10.9 |
| 3 | CD37 (Bass-D) | 10.9 |
| 4 | CD28 (Schiff-D) | 11.1 |
| 5 | CD16 (Costa-D) | 12.0 |
| 6 | CD51 (Vargas-D) | 11.9 |
| 7 | CD32 (Napolitano-D) | 11.0 |
| 9 | CD34 (Gomez-D) | 12.0 |
| 10 | CD21 (Cox-D) | 12.4 |
| 12 | CD40 (Roybal-Allard-D) | 13.1 |
| 13 | CD44 (Barragan-D) | 14.5 |
| wdt_ID | Senate District | Unemployment Rate |
|---|---|---|
| 2 | SD22 (Rubio-D) | 9.9 |
| 3 | SD12 (Caballero-D) | 10.6 |
| 4 | SD18 (Hertzberg-D) | 10.9 |
| 5 | SD24 (Durazo-D) | 12.1 |
| 6 | SD21 (Wilk-R) | 11.3 |
| 7 | SD40 (Hueso-D) | 10.9 |
| 9 | SD35 (Bradford-D) | 12.2 |
| 10 | SD30 (Mitchell-D) | 12.4 |
| 12 | SD33 (Gonzalez-D) | 12.5 |
| 13 | SD14 (Hurtado-D) | 13.5 |
| wdt_ID | Assembly District | Unemployment Rate |
|---|---|---|
| 2 | AD26 (Mathis-R) | 11.4 |
| 3 | AD46 (Nazarian-D) | 12.1 |
| 4 | AD31 (Arambula-D) | 12.1 |
| 5 | AD32 (Salas-D) | 12.8 |
| 6 | AD36 (Lackey-R) | 12.6 |
| 7 | AD56 (Garcia-D) | 11.8 |
| 9 | AD63 (Rendon-D) | 13.4 |
| 10 | AD51 (Carrillo-D) | 13.6 |
| 12 | AD64 (Gipson-D) | 14.1 |
| 13 | AD59 (Jones-Sawyer-D) | 14.3 |
Unemployment Rates by Region
Unemployment rates (not seasonally adjusted) continued to reflect the regional mix of jobs that have been retained through telework compared to relative shares of lower wage services and tourism jobs that have been hit the hardest by the state-ordered closures and other restrictions.
| wdt_ID | Region | Unemployment Rates |
|---|---|---|
| 2 | California | 8.2 |
| 6 | Bay Area | 5.8 |
| 10 | Orange County | 6.4 |
| 14 | Sacramento | 6.8 |
| 18 | San Diego/Imperial | 7.2 |
| 22 | Central Sierra | 7.5 |
| 26 | Inland Empire | 7.7 |
| 30 | Upstate California | 8.1 |
| 34 | Central Coast | 8.5 |
| 38 | Central Valley | 10.2 |
| 39 | Los Angeles | 10.4 |
Figure Source: California Employment Development Department
How Far Back Has the Economy in Each County Been Pushed?
As an indication of the severity of the current economic downturn, the following chart illustrates how much economic ground each county has lost using employment levels as the measure. Based on annual averages, the chart below indicates the last year each county saw the March employment numbers. Because the current series only goes back to 1990 for most counties, several of the entries indicate “Before 1990.” Los Angeles County is the exception, with data going back to 1976. The “Change” column indicates the change from April, the month reflecting the effects of the initial round of closures.
| wdt_ID | County | Last Year Employment Equal To or Less Than April 2020 | Last Year Employment Equal to or Less Than March 2021 | change |
|---|---|---|---|---|
| 2 | Alameda County | 1998 | 2013 | |
| 3 | Alpine County | 1993 | 2018 | |
| 4 | Amador County | 1995 | 2015 | |
| 5 | Butte County | 1997 | 1999 | |
| 6 | Calaveras County | 2012 | 2016 | |
| 7 | Colusa County | 2003 | 2006 | |
| 8 | Contra Costa County | 1997 | 2013 | |
| 9 | Del Norte County | Before 1990 | 1993 | |
| 10 | El Dorado County | 1999 | 2016 | |
| 11 | Fresno County | 2011 | 2014 | |
| County | Last Year Employment Equal To or Less Than April 2020 | Last Year Employment Equal to or Less Than March 2021 | change |
MSAs with the Worst Unemployment Rates: Los Angeles 8th Worst in Nation
California had 10 of the MSAs among the 25 regions with the worst unemployment rates in February. Los Angeles-Long Beach-Anaheim MSA (Los Angeles and Orange Counties) was again dropped, recording the 8th worst in the nation.
| wdt_ID | MSA | February Unemployment Rate | US Rank out of 389 |
|---|---|---|---|
| 1 | El Centro MSA | 15.9 | 389 |
| 2 | Merced MSA | 11.5 | 381 |
| 3 | Visalia-Porterville MSA | 11.4 | 380 |
| 4 | Salinas MSA | 10.9 | 378 |
| 5 | Bakersfield MSA | 10.8 | 377 |
| 6 | Hanford-Corcoran MSA | 10.7 | 376 |
| 7 | Yuba City MSA | 10.1 | 374 |
| 8 | Los Angeles-Long Beach-Anaheim MSA | 9.9 | 369 |
| 9 | Fresno MSA | 9.9 | 369 |