Highlights for policy makers:
- COVID-19 and the State Economy: Most Recent Data
- Unemployment Rate Notches Down; Employment Up 60,700
- Labor Force Participation Rate Down at 59.3%
- Employment Growth Ranking
- Nonfarm Jobs Up 141.6k
- Jobs Change by Industry
- Unemployment Rates by Region (not seasonally adjusted)
- Unemployment Rates by Legislative District (not seasonally adjusted)
- How Far Back Has the Economy in Each County Been Pushed?
- Employment Share by Region
- MSAs with the Worst Unemployment Rates
COVID-19 and the State Economy: Most Recent Data
The May numbers provide a more complete picture of the extent of damage to the state’s economy stemming from the emergency social distancing measures.
Recession Tracking. As a base indicator tool to summarize these changes as they occur, the following chart contains the most recent employment estimates by industry along with the 12-month change taken from the revised data for the same month in the prior year. The data used is the unadjusted numbers to show actual job levels held by Californians rather than the statistical levels from the seasonally adjusted data, and to enable use of the average wage and hours worked numbers where available from this series. Within this chart, note that “employment” is the number of persons age 16 and over working, including wage & salary jobs, self-employment, and non-paid family workers in the civilian workforce. “Jobs” are the number of wage & salary jobs, with individual workers holding one or more of these jobs.
As indicated below, job numbers were below the 2019 levels in all but 3 industries, with the greatest contraction in lower wage Leisure & Hospitality where jobs again were almost cut in half.
Where the information is available, average hourly earnings rose in all industries except Information. These numbers do not necessarily represent wage growth but instead likely reflect the fact that layoffs have generally affected lower wage workers more heavily. The averages went up because the lower wages were cut more proportionally. These jobs are more likely to require customer contact or a physical presence at a work location, and even where telework is possible, the high litigation risks under California’s labor laws make this work option less likely. Higher wage jobs have been more amenable to retention through telework and other work options, both from the standpoint of work characteristics and the state’s regulations.
Average weekly hours also continued to soften for several industries. The notable rise for Other Services likely also reflects the wage effect above. With this industry showing high layoff levels, the remaining workers are again likely higher wage workers capable of telework or owners/management taking up more responsibilities under the current conditions.
The monthly numbers also again indicate another effect. Similar to the April numbers, the most recent data shows a convergence between the establishment (jobs) and household (employment) estimates. This outcome may reflect some degree of resiliency as multiple job holders retain at least one in the current period, but it also suggests an added destructive element coming from last year’s AB 5 as self-employment has been forced by regulation into wage and salary but not necessarily on a one-for-one basis.
Source: US Bureau of Labor Statistics
Current Indicators. While the labor force and job numbers provide data about a month in arrears, WARN Act data provides an early if somewhat imperfect indicator of job reductions more in current time. The California and Federal WARN Acts require employers to give a 60-day notice prior to a facility closure or mass layoff. While the Governor has paused the associated penalties for not meeting the requirements, the requirements themselves remain in place. As a result, these notices are a better indicator of the geographic distribution of layoffs rather than the current actual number. Many notices being filed continue to cover layoffs from prior rather than the current month.
Most notices continue to cover temporary layoffs and closures, with 10.8% indicating the layoffs are permanent. This number continues to fluctuate with each 2-week update, but is higher than levels at the beginning of the current downturn. While the continuing high number of temporary layoffs indicates a quick recovery is still possible if conditions within the state allow it, the rising number of permanent layoffs suggests that the extended closures are beginning to have longer lasting effects. And comparing the WARN Act numbers with both the UI and employment numbers may also indicate that there are many, particularly smaller businesses who are no longer around to complete these or any other mandated reports.
Another current indicator is weekly initial claims for Unemployment Insurance (UI). Although easing substantially from the early spikes in March, California claims remain well above historic levels particularly when incorporating claims under the new Pandemic Unemployment Assistance (PUA) program for the self-employed. Over the past 5 weeks, however, the total number has largely stabilized around a level about 8 times higher than the average for 2019. Layoffs continue, but a rate that has not substantially moved one way or another in those 5 weeks.
For the weeks of March 21 through June 6, total initial claims under both programs totaled 5,977,200. These are initial claims, and do not account for persons who have filed more than once, workers who secured a job after filing, and claims that were rejected in the process. However, putting these factors aside, that number encompasses 32% of the May labor force.
Two-Tier Recession. The recently ended recovery from the 2008 recession was heavily stratified into two tiers. Considered by industry, jobs creation was heavily concentrated in the higher and lower wage levels, with far lower growth and even shrinkage within the traditional middle class wage levels. Considered by region, a large share of the higher pay jobs were generated in the Bay Area, with the more vulnerable areas such as Los Angeles now seeing higher relative job loss due to the types of jobs that were created there over the previous 12 years.
The current downturn is having the same two-tier effect, with much higher job losses in the lower wage industries as a combination of two factors—these were the types of jobs created over the past 12 years due to conditions in the state, and many of these lower pay jobs are not amenable to being sustained through options such as telework due to the nature of the job and restrictions under the state’s labor laws. The following table illustrates this outcome using the most recent job loss data (May 2019 compared to May 2020, not seasonally adjusted data) with the most recent annual wage data from the comparable Quarterly Census of Employment & Wages designations. The primary exception to the lower wage effect is Social Assistance, primarily composed of In-Home Supportive Services workers who in any event conduct their work at home.
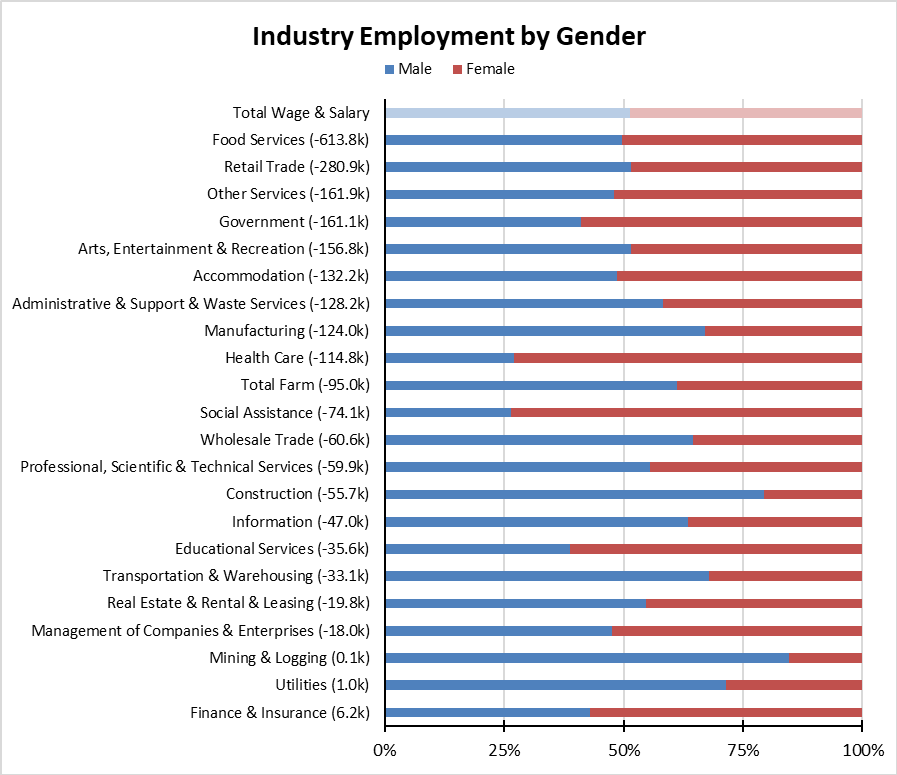
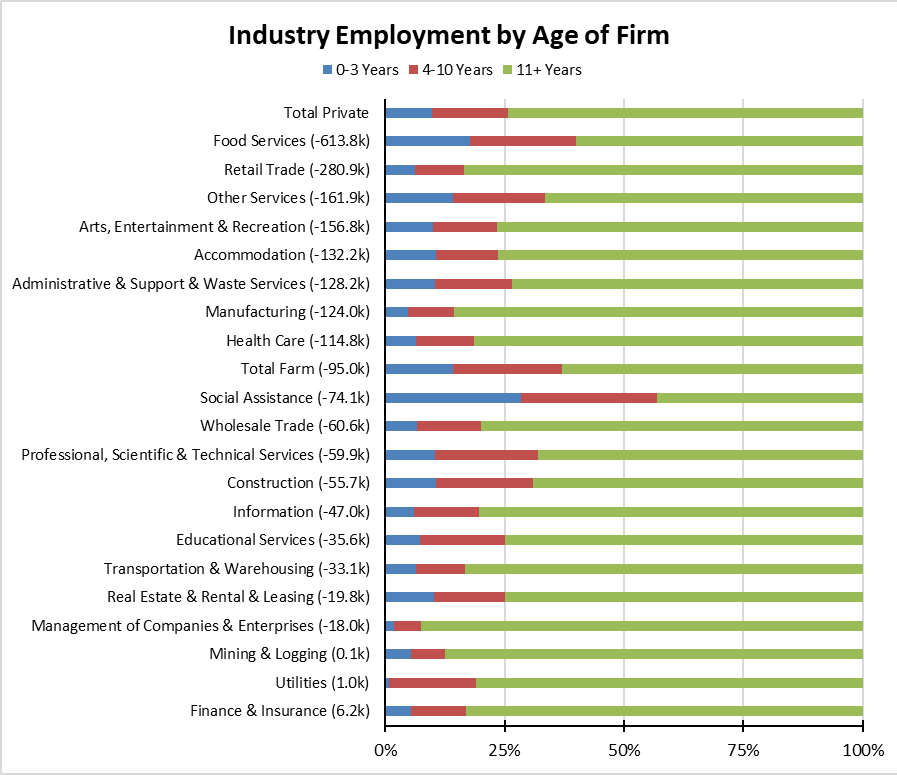
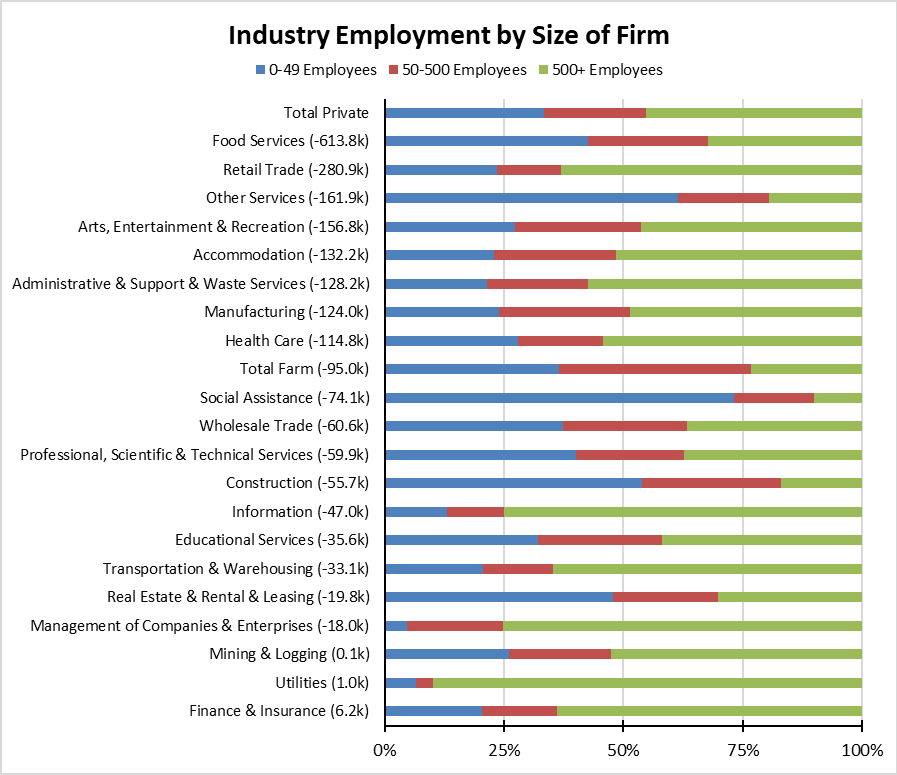
The two-tier structure of California’s economy prior to the March closures is also having an effect on the demographics of the current unemployment numbers—those officially considered unemployed, those misclassified but who should be considered unemployed, and the many who have left the labor force and are not counted at all. The following figures illustrate this demographic structure using the Quarterly Workforce Indicator data to show the profile of workers within each industry prior to the current downturn. Most figures use the most current data for Q3 2018 through Q2 2019, while the firm age and firm size figures use the most current data from 2017. All industries are listed according to the May 2020 job losses (shown in parentheses).
By Gender, the top 5 job loss industries except for Government run close to the structure for Wage & Salary jobs as a whole. Those with the fewest job losses to date instead tend to show a larger percentage of male workers with the exception of Educational Services and Social Assistance.
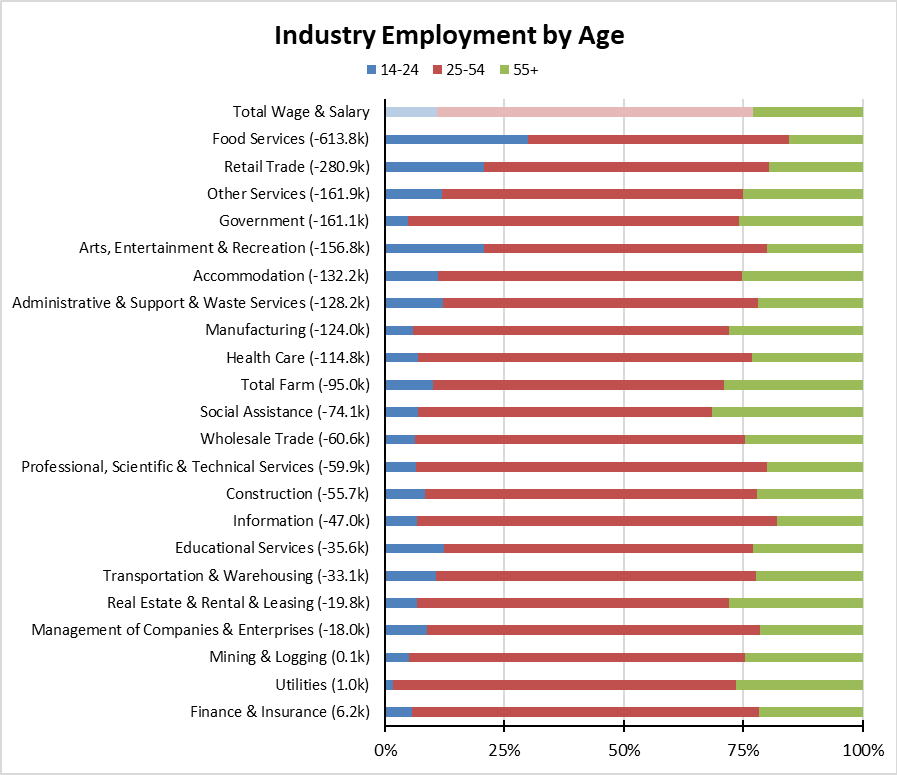
By age of worker, the hardest hit industries show a much greater percentage of youth and young adult workers. The subsequent layoffs consequently add to the state’s already low employment rate for young adults and abysmally low rate for youth, as well as indicating far fewer employment opportunities for these workers particularly as they continue with their educations.
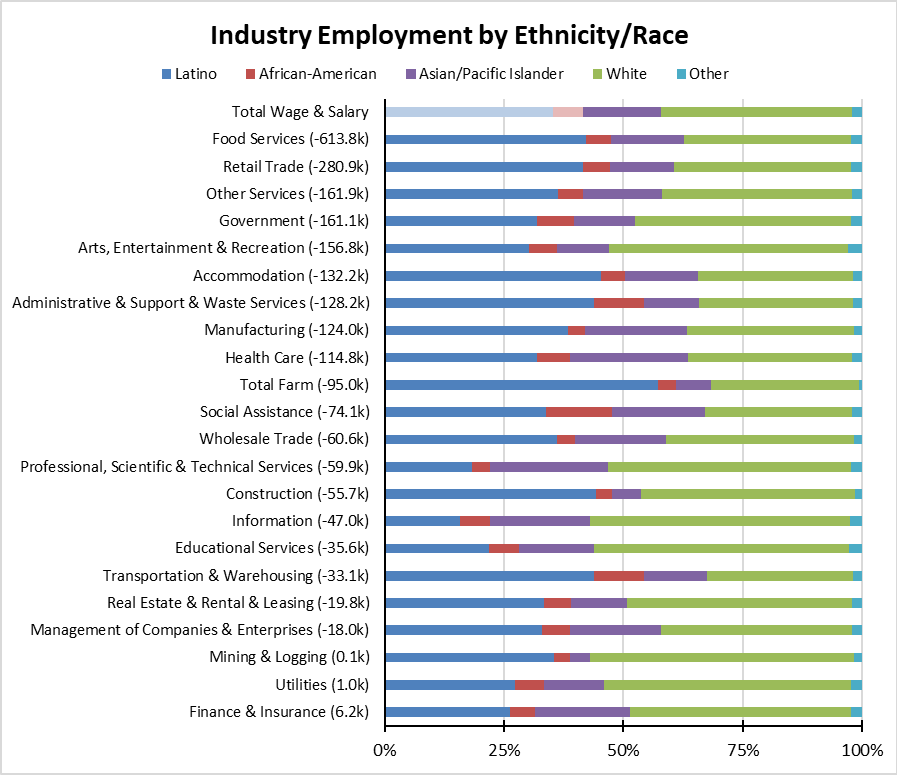
By ethnicity and race, the top job loss industries show somewhat higher percentages of minority workers, but the core industries with higher shares lie within the roughly 100,000 job loss range. These include a mix of high wage blue collar jobs along with lower wage industries such as Social Assistance.
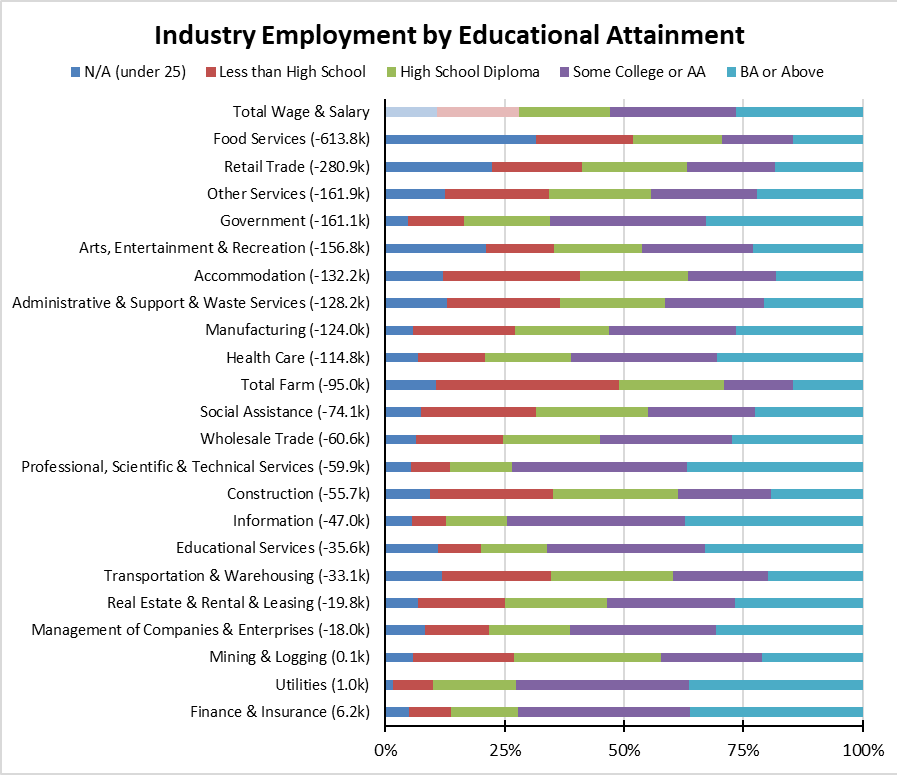
By educational attainment, the highest job loss industries have been important sources of employment for workers with a high school education or less. Note that educational attainment is determined for persons age 25 and older, and the n/a component (persons under 25) includes workers conceivably still within their educational progress. Industries showing some the lower job losses are those requiring more workers with at least some college, again indicating that telework as currently allowed within the state is contributing to the two-tier effects currently underway.
By age of firm, some of the highest job loss industries are those with the youngest age structure. These are businesses with less established cash flow and financial reserves, and represent jobs that are less likely to be able to come back in the forthcoming recovery.
The same structure is shown when looking at the prevalence of small businesses within each industry. Two of the top 3 job loss industries have a far greater percentage of small businesses. Their greater odds against survival in the current conditions means many of the jobs currently lost are at risk to becoming permanent in a slow, shallow recovery similar to that experienced after the 2008 recession.
The demographic structures illustrated above contribute greatly to the demographics of the current spike in the number of unemployed in the state. This is important in the current circumstances as to which workers are facing the greatest current impacts. It has a greater significance within the pending recovery as to the kind and wage level of jobs that will become available, and which numbers that currently are temporary layoffs are at risk of becoming permanent.
Most indicators at least at the national level are that we are now in a “V” stage of recovery, and many private data sources coming in advance of the June data reinforce this picture. The issue will be whether the “V” continues or it turns into a “swoosh” as currently projected by Department of Finance and LAO, with a much longer, shallower recovery period similar to the experience of recent years. The state has yet to take any measures to accelerate recovery, and instead continues to create additional regulatory and cost barriers that will affect both households and jobs formation in the upcoming period.
Job opportunities even prior to the current downturn were already facing a number of potential headwinds including automation, industry transformations such as retail from brick-and-mortar to online sales, and continuing competitive challenges from other states and other nations. The additional cost challenges and regulatory barriers within California place additional burdens on employers seeking to reopen, in particular for smaller and younger companies from a severely reduced financial base. The recovery risks seeing these headwinds intensified, with full recovery potentially producing fewer jobs than what existed before. Other states and other countries are seeking to expand jobs and household incomes wherever they can. For example, even China is now allowing previously banned street vendors in a move to simply get workers and households back to work. California instead continues to shut down work opportunities such as through last year’s overreaching AB 5.
The current structure of job losses is clearly seen through other indicators such as state income tax withholding. Recent reports continue to show withholding receipts running at only 4-5% below last year, with the most recent week only 2% below. In other words, Californians whose incomes are high enough that they pay state income taxes are continuing to work—including greatly expanded telework. Layoffs instead have been more prevalent among lower income workers, reflecting the industry structures shown above.
While more complete information will not become available until the recovery is more fully underway, initial studies are beginning to suggest that the effects of the downturn have created challenges to a broad based recovery. A recent paper analyzing Current Population Survey data estimates that nationally, the number of small business owners plunged by 3.3 million, or 22%. African-American owners were hit far harder, dropping by 41%. Latino small businesses fell by 32%, and Asian-owned businesses somewhat higher at 26%. Immigrant-owned businesses fell by 36%.
These factors while important under any circumstances are particularly pressing in the current circumstances. As with the recessions that began in 1990 and 2008, the state appears to be starting on the road to recovery from further behind. Based on the most recent, although as discussed below incomplete, data, the state’s unemployment rate is nearly a quarter higher than the US average. The labor force has fallen farther. We represent 14% of the nation’s official unemployment. Total employment is down 16.5% for the year compared to 12.0% for the rest of the nation. In the most recent weekly data, California accounted for 39% of initial applications for extended unemployment insurance under the new Pandemic Emergency Unemployment Compensation (PEUC) Program. This is not an unsurmountable position, but it risks an intensification of the two-tier economic structure if the state relies once again on high earner jobs for the highly educated, and only low wage service sector jobs for the many who are now unemployed.
Unemployment Rate Notches Down; Employment Up 60,700
EDD reported total employment (seasonally adjusted; May preliminary) dropped 60,700 from the revised April numbers, while the number of unemployed dipped by 25,100. The reported unemployment rate notched down 0.1 point to 16.3% primarily as the result of fewer workers in the labor force. The unadjusted rate was up 12.3 points from the year earlier to 15.9%.
California had the 4th highest unemployment rate among the states.
Total US employment saw a seasonally adjusted gain of 3,839,000, with the number of unemployed dropping by 2,093,000. The reported unemployment rate dropped to 13.3%.
Figure Sources: California Employment Development Department; US Bureau of Labor Statistics
While the California numbers suggest the economic downturn may have bottomed out if not beginning to improve, the US numbers indicate much of the rest of the country may be further along in the economic recovery phase. In part, this is due to the fact that not all states adopted economic closures as early, as long, and as broadly as California. The strength and durability of the recovery will not be known until further information becomes available in future months and will depend heavily on trends in the disease itself.
The reported numbers, however, continue to have several underlying weaknesses for portraying the full economic effects from the social distancing measures:
- Agency and press reports continue to focus on the seasonally adjusted data. Normally this approach is reasonable to convey longer term trends, especially in states such as California with high seasonal variability due to a relatively larger component of employment in tourism, agriculture, and international trade in addition to typical factors such as retail trade and teachers. The current downturn is not the result of a seasonal event. It is, hopefully, a one-time perturbation that has had a major effect on all the economic data. The unadjusted data in addition to its wider availability for sub-state areas is more an accurate reflection of what is happening to workers and businesses. As indicated in the labor force tables above, the 2nd Quarter is generally the period where the two data series come the closest, but this difference is more pronounced in other series such as Initial Unemployment Insurance Claims and some of the industry data.
- As indicated in prior reports, the core data is based on two surveys done the week of the 12th in each month. The economy has continued to shift dramatically throughout each month. For example, while the Initial Claims data is leveling out, it is doing so both nationally and in California at rates substantially above the historic levels. In many cases, the official survey data continues to be outdated as soon as it is acquired.
- As reported by BLS for the third month now, the surveys also continue to have technical problems due to the current situation. Response rates remain well below typical levels, although the data appears to still meet the BLS standards for statistical validity. More critical is the continuing underreporting of unemployment due to misclassifications in the data. Although the size of this error has been declining as BLS has made adjustments in the surveys, the household survey used for labor force estimates still has a significant rate of misclassification of persons indicating they are “employed, but not at work” instead of the more correct designation of “unemployed on temporary layoff.” BLS estimates that a correction for this factor would have raised the reported national unemployment rate by 3 percentage rates. This effect, however, is lower than in previous months, and indicates that overall unemployment has fallen to somewhere below the 20% level. Similar problems, although based on the Current Population Survey data at a somewhat higher level, affect the California numbers as well.
Labor Force Participation Rate Down at 59.3%
California’s seasonally adjusted labor force participation rate was down at 59.3%. Nationally, the participation rate rose to 60.8%.
For the 12 months ending May 2019, the seasonally adjusted data shows the California labor force was down 841,300 workers (-4.4% loss) compared to the rest of the US loss of 3,713,700 (-2.6%). The reported unemployment rates also have to be viewed in the context that large numbers of workers no longer are in the labor force.
Employment Growth Ranking
The total number of persons employed (seasonally adjusted) over the 12 months ending in May plunged by 3,066,700. California had the lowest level in terms of absolute employment loss over the year.
Adjusted to account for differences in the size of each state economy, California over the year showed a 16.5% contraction, far deeper than for the rest of the US with a loss of 12.0%. Ranked among the states, California’s loss rate was the 44th highest.
Figure Source: US Bureau of Labor Statistics
Nonfarm Jobs Up 141.6k
Nonfarm jobs (seasonally adjusted) rose 141,600 as April’s seasonally adjusted losses were revised to 2,415,000 from the previously reported 2,344,700. These numbers reflect the situation that even during the months of massive layoffs, many businesses continued to hire particularly those providing delivery services to replace in-store sales to their customers.
The historic April numbers largely account for the 12-month loss of 2,267,100 nonfarm jobs, the most of any state. Adjusting for population size, California was 36th among the states, with a 12-month jobs loss rate of -13.0% compared to the rest of the US at -11.6%.
Figure Sources: California Employment Development
Department; US Bureau of Labor Statistics
Jobs Change by Industry
In the unadjusted numbers that allow a more detailed look at industry shifts, all but 3 industries posted job losses over the 12-month period. Utilities as an essential service and Finance & Insurance with a high incidence of telework opportunities remained positive although largely unchanged. Mining & Logging also showed minor improvement as oil prices moved from their previous lows.
Industries showing the greatest contractions were those generally requiring customer contact or a physical presence at a work location. These were led by lower wage Food Services, Retail Trade, Accommodation, and Other Services but also included the middle-class wage level Government and Arts, Entertainment & Recreation. A second grouping of generally higher wage blue/white collar industries requiring less than a college degree showed high but less severe contractions: Construction, Administrative & Support & Waste Services, and Manufacturing. The higher wage industries experienced far smaller losses due to their ability to maintain employment through telework and other options, both due to the nature of these jobs and restrictions under California’s labor laws that apply primarily to lower wage workers. Social Assistance, composed primarily of In-Home Supportive Services workers who perform their duties in the home under any circumstances, was the exception.
Figure Source: California Employment Development Department;
Wages based on most recent Quarterly Census of Employment & Wages
Unemployment Rates by Region (not seasonally adjusted)
Regions with jobs providing greater telework options—both due to the nature of the jobs and under the state’s regulations—including the Bay Area, Orange County, and Sacramento saw somewhat lower unemployment rates. Regions with higher concentrations of blue collar and lower wage jobs including the Central Valley and Los Angeles had much higher rates.
| wdt_ID | Region | Unemployment Rates |
|---|---|---|
| 2 | California | 15.9 |
| 6 | Bay Area | 12.4 |
| 10 | Sacramento | 13.6 |
| 14 | Upstate California | 13.7 |
| 18 | Orange County | 14.5 |
| 22 | Inland Empire | 14.9 |
| 26 | Central Coast | 15.0 |
| 30 | San Diego/Imperial | 15.6 |
| 34 | Central Sierra | 15.8 |
| 38 | Central Valley | 16.8 |
| 39 | Los Angeles | 19.8 |
Figure Source: California Employment Development Department
Unemployment Rates by Legislative District (not seasonally adjusted)
Lowest
| wdt_ID | Congressional District | Unemployment Rate |
|---|---|---|
| 2 | CD18 (Eshoo-D) | 9.3 |
| 3 | CD17 (Khanna-D) | 10.7 |
| 4 | CD15 (Swalwell-D) | 11.5 |
| 5 | CD49 (Levin-D) | 12.0 |
| 6 | CD12 (Pelosi-D) | 12.0 |
| 7 | CD02 (Huffman-D) | 11.6 |
| 9 | CD52 (Peters-D) | 12.2 |
| 10 | CD14 (Speier-D) | 12.3 |
| 12 | CD19 (Lofgren-D) | 12.6 |
| 13 | CD24 (Carbajal-D) | 12.8 |
| wdt_ID | Senate District | Unemployment Rate |
|---|---|---|
| 2 | SD13 (Hill-D) | 10.0 |
| 3 | SD10 (Wieckowski-D) | 11.6 |
| 4 | SD15 (Beall-D) | 11.7 |
| 5 | SD36 (Bates-R) | 12.4 |
| 6 | SD02 (McGuire-D) | 12.4 |
| 7 | SD07 (Glazer-D) | 12.6 |
| 8 | SD39 (Atkins-D) | 12.6 |
| 9 | SD01 (Dahle-R) | 12.7 |
| 10 | SD11 (Wiener-D) | 12.8 |
| 11 | SD03 (Dodd-D) | 12.8 |
| wdt_ID | Assembly District | Unemployment Rate |
|---|---|---|
| 2 | AD16 (Bauer-Kahan-D) | 9.3 |
| 3 | AD28 (Low-D) | 9.5 |
| 4 | AD22 (Mullin-D) | 10.2 |
| 5 | AD24 (Berman-D) | 9.9 |
| 6 | AD77 (Maienschein-R) | 12.2 |
| 7 | AD10 (Levine-D) | 11.5 |
| 8 | AD06 (Kiley-R) | 11.5 |
| 9 | AD25 (Chu-D) | 10.6 |
| 10 | AD78 (Gloria-D) | 11.8 |
| 11 | AD75 (Waldron-R) | 12.3 |
Highest
| wdt_ID | Congressional District | Unemployment Rate |
|---|---|---|
| 2 | CD21 (Cox-D) | 19.8 |
| 3 | CD28 (Schiff-D) | 20.5 |
| 4 | CD32 (Napolitano-D) | 20.5 |
| 5 | CD43 (Waters-D) | 21.8 |
| 6 | CD29 (Cardenas-D) | 21.5 |
| 7 | CD37 (Bass-D) | 20.8 |
| 9 | CD34 (Gomez-D) | 22.0 |
| 10 | CD40 (Roybal-Allard-D) | 23.8 |
| 12 | CD51 (Vargas-D) | 23.8 |
| 13 | CD44 (Barragan-D) | 26.4 |
| wdt_ID | Congressional District | Unemployment Rate |
|---|---|---|
| 2 | SD32 (Archuleta-D) | 17.9 |
| 3 | SD22 (Rubio-D) | 18.9 |
| 4 | SD21 (Wilk-R) | 20.7 |
| 5 | SD40 (Hueso-D) | 22.0 |
| 6 | SD18 (Hertzberg-D) | 21.6 |
| 7 | SD14 (Hurtado-D) | 21.3 |
| 9 | SD24 (Durazo-D) | 22.5 |
| 10 | SD33 (Gonzalez-D) | 23.1 |
| 12 | SD30 (Mitchell-D) | 23.1 |
| 13 | SD35 (Bradford-D) | 23.4 |
| wdt_ID | Congressional District | Unemployment Rate |
|---|---|---|
| 2 | AD48 (Rubio-D) | 21.0 |
| 3 | AD62 (Burke-D) | 21.3 |
| 4 | AD56 (Garcia-D) | 21.6 |
| 5 | AD36 (Lackey-R) | 23.6 |
| 6 | AD46 (Nazarian-D) | 23.5 |
| 7 | AD80 (Gonzalez-D) | 21.9 |
| 9 | AD63 (Rendon-D) | 24.8 |
| 10 | AD51 (Carrillo-D) | 25.2 |
| 12 | AD64 (Gipson-D) | 25.5 |
| 13 | AD59 (Jones-Sawyer-D) | 26.2 |
How Far Back Has the Economy in Each County Been Pushed?
As an indication of the severity of the current economic downturn, the following chart illustrates how much economic ground each county has lost using employment levels as the measure. Based on annual averages, the chart below indicates the last year each county saw the May employment numbers. Because the current series only goes back to 1990 for most counties, several of the entries indicate “Before 1990.” Los Angeles County, which is the exception, last saw the May 2020 employment levels in 1985. The “Change” column indicates the change from the April base year, with counties such as Sacramento and Sonoma showing substantial improvement, but many smaller rural counties being pushed further back in economic time.
| wdt_ID | County | Last Year Employment Equal To or Less Than April | Last Year Employment Equal to or Less Than May | Change |
|---|---|---|---|---|
| 2 | Alameda County | 2009 | 2010 | 1 |
| 3 | Alpine County | 2010 | 2010 | 0 |
| 4 | Amador County | 1999 | 1996 | -3 |
| 5 | Butte County | 1999 | 1999 | 0 |
| 6 | Calaveras County | 2013 | 2013 | 0 |
| 7 | Colusa County | 2017 | 2012 | -5 |
| 8 | Contra Costa County | 1998 | 1998 | 0 |
| 9 | Del Norte County | 1993 | 1990 | -3 |
| 10 | El Dorado County | 1998 | 1999 | 1 |
| 11 | Fresno County | 2014 | 2014 | 0 |
| County | Last Year Employment Equal To or Less Than April | Last Year Employment Equal to or Less Than May | Change |
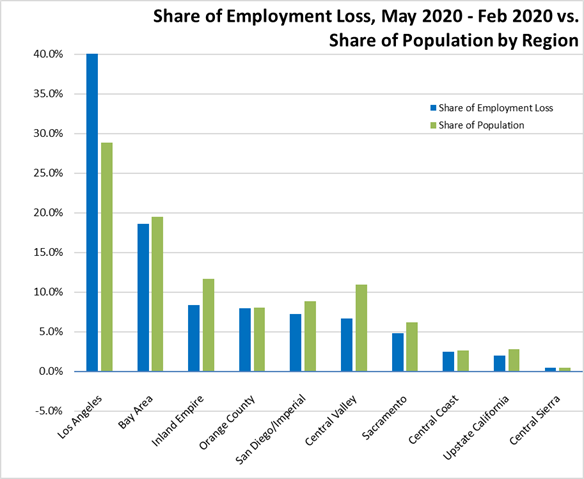
Employment Share by Region
The following chart compares change in employment (compared to pre-Covid February 2020) vs. population share as a measure of the disparate economic effects from the social distancing measures. Los Angeles Region, which experienced relatively greater job creation in lower income, population-serving and tourism industries during the recently ended recovery period, has to date sustained a commensurately far greater relative and absolute employment loss in the current economic downturn. Regions such as the Bay Area and San Diego with a greater incidence of jobs amenable to telework have been slightly less impacted. Regions such as the Central Valley and Inland Empire with a higher degree of essential businesses but also effects from seasonal factors have shown somewhat greater resiliency.
MSAs with the Worst Unemployment Rates
As job losses have been more widespread, only one California MSA—El Centro (Imperial County)—fell within the 20 worst unemployment rates in April, with the 8th worst unemployment rate in the country. The other leading MSAs largely consisted of those with substantial dependence on tourism, including MSAs in Hawaii, Nevada, and Gulf and East Coast tourism destinations.