Highlights for policy makers:
- Unemployment Unchanged at 3.9%; Employment Up 53,700
- Labor Force Participation Rate Level Up to 62.2%
- Employment Growth Ranking
- Nonfarm Jobs Up 28,400 for Month; California Dips to #2 for 12-month Gain
- Jobs Change by Industry
- Structural Shifts in State’s Economy
- Unemployment Rates by Region (not seasonally adjusted)
- Unemployment Rates by Legislative District
- Employment Growth by Region
- MSAs with the Worst Unemployment Rates
- Chart of the Month: County GDP
Unemployment Unchanged at 3.9%; Employment Up 53,700
EDD reported total employment (seasonally adjusted; November preliminary) was up 53,700 from the revised October numbers, while the number of unemployed dipped 3,700. Unemployment rate remained at the series low of 3.9%. The unadjusted rate was down 0.2 point from the year earlier to 3.5%, matching May’s rate level as the lowest in the current series stretching back to 1976.
California again had the 15th highest unemployment rate among the states.
Total US employment saw a seasonally adjusted gain of 83,000, with the number of unemployed down by 44,000. The unemployment rate dipped to 3.5%, matching September’s rate as the lowest since 1969.
Figure Sources: California Employment Development Department; US Bureau of Labor Statistics
Labor Force Participation Rate Level Up to 62.2%
California’s seasonally adjusted labor force participation rate edged up to 62.2%. Nationally, the participation rate dipped to 63.2%. The state continues to experience lower than average participation rates in spite of having a relatively younger population than the rest of the US.
For the 12 months ending November 2019, the seasonally adjusted data shows the California labor force produced little change, with a dip of 17,100 workers (-0.1% growth) compared to the rest of the US gain of 1.6 million (+1.1%).
The continuing stall out in labor force growth has significant implications for the California economy. The increasing difficulty of finding qualified workers, and in some cases any workers, puts California businesses at a competitive disadvantage to other states where the current expansion continues to draw workers back into the labor force. At the same time, this situation produces caseload demands on state and local welfare and other social assistance budgets well above where they should be given the current stage of the extended recovery.
Employment Growth Ranking
The total number of persons employed (seasonally adjusted) over the 12 months ending in November grew by only 22,700. California rose to tie with New Mexico for the 24th highest rank, with Texas leading with an additional 255,900 persons employed over this period, and Florida in second place with a gain of 220,900.
Adjusted to account for differences in the size of each state economy, California grew by only 0.1%, below the average for the rest of the US with a gain of 1.3%. Ranked among the states, California’s growth rate also edged up to 44th place, while Alabama led with 3.9% growth.
Figure Source: US Bureau of Labor Statistics
Nonfarm Jobs Up 28,400 for Month; California Dips to #2 for 12-month Gain
Nonfarm jobs (seasonally adjusted) were up 28,400 as October’s gains were revised to 32,000 from the previously reported 23,600.
For the 12 months ending November, total jobs growth was 321,800, dipping the state’s rank to 2nd place behind Texas which gained 336,700 jobs in this period, with Florida in third at 217,400.
Adjusting for population size, California remained 14th among the states, with a 12-month jobs growth rate of 1.9% compared to the rest of the US at 1.4%.
Figure Sources: California Employment Development Department; US Bureau of Labor Statistics
Jobs Change by Industry
In the unadjusted numbers that allow a more detailed look at industry shifts, hiring saw increases in all but 3 industries over the year.
Gains in payroll jobs were again led by Health Care ($68.1k average annual wages), Social Assistance ($19.8k), and Government ($70.1k). All three industries are heavily affected either directly or indirectly by the level of state spending.
Declines were again seen in Wholesale Trade ($78.3k), Retail Trade ($36.7k), and Other Services ($40.7k).
All wage data is from the most current 4-quarter average from the Quarterly Census of Employment & Wages.
| Not Seasonally Adjusted Payroll Jobs (1,000) | Nov 2019 | 12-month change |
|---|---|---|
| Total Farm | 418.5 | 7.0 |
| Mining & Logging | 23.5 | 0.4 |
| Construction | 903.2 | 28.4 |
| Manufacturing | 1,340.7 | 11.9 |
| Wholesale Trade | 697.0 | -3.3 |
| Retail Trade | 1,746.8 | -1.6 |
| Utilities | 57.4 | 0.3 |
| Transportation & Warehousing | 646.8 | 13.5 |
| Information | 571.3 | 18.2 |
| Finance & Insurance | 548.7 | 4.9 |
| Real Estate & Rental & Leasing | 302.5 | 8.9 |
| Professional, Scientific & Technical Services | 1,328.9 | 27.5 |
| Management of Companies & Enterprises | 258.8 | 4.5 |
| Administrative & Support & Waste Services | 1,193.2 | 34.3 |
| Educational Services | 408.4 | 14.7 |
| Health Care | 1,599.5 | 47.5 |
| Social Assistance | 860.6 | 42.6 |
| Arts, Entertainment & Recreation | 316.3 | 6.5 |
| Accommodation | 238.6 | 5.0 |
| Food Services | 1,470.1 | 23.4 |
| Other Services | 573.2 | -1.6 |
| Government | 2,681.4 | 40.2 |
| Total Nonfarm | 17,766.9 | 326.2 |
| Total Wage & Salary | 18,185.4 | 333.2 |
Figure Source: California Employment Development Department
Structural Shifts in State’s Economy
Comparing current job numbers to the pre-recession levels in 2007 illustrates the structural shift in the state’s economy, with the primary jobs growth occurring in the higher and lower wage industries.
Construction is the exception for middle class wage, blue collar industries, with job levels continuing to be within the 2007 levels. Jobs, however, remain 19,500 (6.5%) below the all-time peak reached the year before in 2006. Residential Building Construction still accounts for the bulk of the remaining gap, with the November 2019 job levels 26,500 below the all-time peak in 2006.
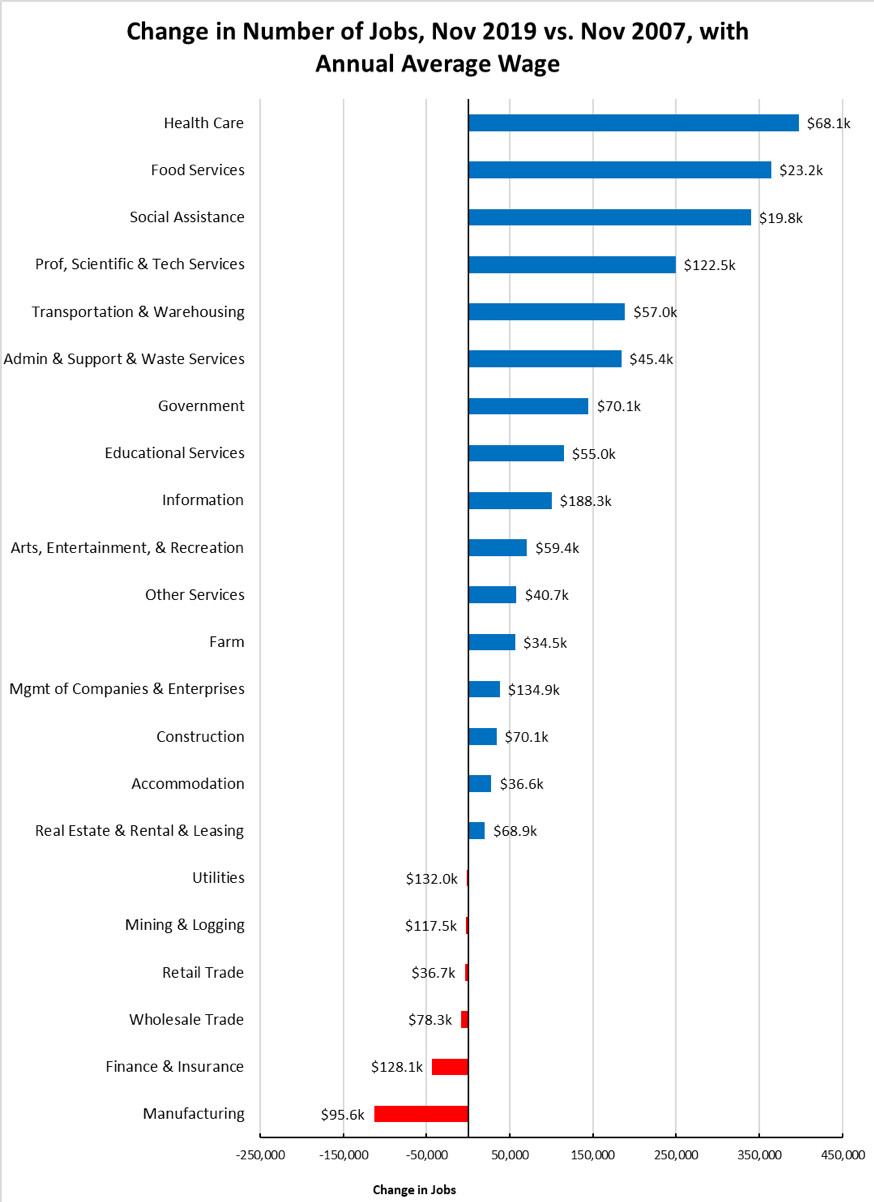
Figure Source: California Employment Development Department
Unemployment Rates by Region (not seasonally adjusted)
| wdt_ID | Region | Unemployment Rates |
|---|---|---|
| 1 | California | 3.7 |
| 2 | Bay Area | 2.4 |
| 3 | Orange County | 2.5 |
| 4 | Sacramento | 3.2 |
| 5 | Central Sierra | 3.5 |
| 6 | San Diego/Imperial | 3.6 |
| 7 | Inland Empire | 3.6 |
| 8 | Central Coast | 3.8 |
| 9 | Los Angeles | 4.1 |
| 10 | Upstate California | 4.4 |
| 11 | Central Valley | 6.3 |
Figure Source: California Employment Development Department
Unemployment Rates by Legislative District
Lowest
| wdt_ID | Congressional District | Unemployment Rate |
|---|---|---|
| 1 | CD12 (Pelosi-D) | 1.8 |
| 2 | CD18 (Eshoo-D) | 1.9 |
| 3 | CD14 (Speier-D) | 2.0 |
| 4 | CD17 (Khanna-D) | 2.1 |
| 5 | CD15 (Swalwell-D) | 2.1 |
| 6 | CD52 (Peters-D) | 2.2 |
| 7 | CD49 (Levin-D) | 2.2 |
| 8 | CD45 (Porter-D) | 2.3 |
| 9 | CD48 (Rouda-D) | 2.4 |
| 10 | CD02 (Huffman-D) | 2.5 |
| wdt_ID | Senate District | Unemployment Rate |
|---|---|---|
| 1 | SD13 (Hill-D) | 1.8 |
| 2 | SD11 (Wiener-D) | 2.0 |
| 3 | SD36 (Bates-R) | 2.3 |
| 4 | SD37 (Moorlach-R) | 2.3 |
| 5 | SD39 (Atkins-D) | 2.3 |
| 6 | SD10 (Wieckowski-D) | 2.3 |
| 7 | SD07 (Glazer-D) | 2.4 |
| 8 | SD15 (Beall-D) | 2.5 |
| 9 | SD02 (McGuire-D) | 2.7 |
| 10 | SD38 (Jones-R) | 2.8 |
| wdt_ID | Assembly District | Unemployment Rate |
|---|---|---|
| 1 | AD22 (Mullin-D) | 1.7 |
| 2 | AD16 (Bauer-Kahan-D) | 1.7 |
| 3 | AD24 (Berman-D) | 1.8 |
| 4 | AD17 (Chiu-D) | 1.9 |
| 5 | AD28 (Low-D) | 2.0 |
| 6 | AD19 (Ting-D) | 2.1 |
| 7 | AD25 (Chu-D) | 2.1 |
| 8 | AD78 (Gloria-D) | 2.2 |
| 9 | AD73 (Brough-R) | 2.2 |
| 10 | AD10 (Levine-D) | 2.3 |
Highest
| wdt_ID | Congressional District | Unemployment Rate |
|---|---|---|
| 1 | CD09 (McNerney-D) | 4.9 |
| 3 | CD43 (Waters-D) | 4.9 |
| 4 | CD10 (Harder-D) | 4.9 |
| 5 | CD22 (Nunes-R) | 6.3 |
| 6 | CD44 (Barragan-D) | 5.8 |
| 7 | CD16 (Costa-D) | 7.2 |
| 8 | CD23 (McCarthy-R) | 5.8 |
| 9 | CD21 (Cox-D) | 7.8 |
| 10 | CD51 (Vargas-D) | 8.4 |
| 11 | CD40 (Roybal-Allard-D) | 4.9 |
| wdt_ID | Senate District | Unemployment Rate |
|---|---|---|
| 1 | SD14 (Hurtado-D) | 8.9 |
| 2 | SD40 (Hueso-D) | 7.0 |
| 3 | SD35 (Bradford-D) | 5.2 |
| 4 | SD30 (Mitchell-D) | 5.0 |
| 5 | SD08 (Borgeos-D) | 5.1 |
| 6 | SD16 (Grove-R) | 5.5 |
| 7 | SD24 (Durazo-D) | 4.7 |
| 8 | SD12 (Caballero-D) | 5.9 |
| 9 | SD33 (Gonzalez-D) | 4.8 |
| 11 | SD05 (Galgiani-D) | 5.1 |
| wdt_ID | Assembly District | Unemployment Rate |
|---|---|---|
| 1 | AD13 (Eggman-D) | 5.8 |
| 2 | AD59 (Jones-Sawyer-D) | 5.7 |
| 3 | AD36 (Lackey-R) | 5.3 |
| 4 | AD21 (Gray-D) | 6.4 |
| 6 | AD64 (Gipson-D) | 5.8 |
| 7 | AD31 (Arambula-D) | 7.9 |
| 8 | AD32 (Salas-D) | 7.8 |
| 9 | AD26 (Mathis-R) | 8.2 |
| 10 | AD56 (Garcia-D) | 10.1 |
| 11 | AD23 (Patterson-R) | 5.4 |
Employment Growth by Region
Containing 19.5% of the state’s population, the Bay Area has accounted for 38.0% of net employment growth compared to pre-recession levels. Los Angeles Region, with 29.0% of the population, accounted for only 16.6% of net employment gains, while Inland Empire continues to rank the second highest.
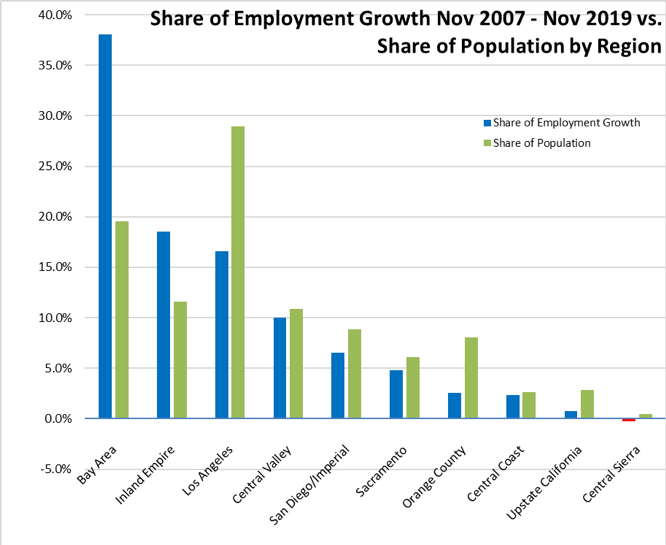
Figure Sources: California Employment Development Department; Department of Finance
MSAs with the Worst Unemployment Rates
Of the 20 Metropolitan Statistical Areas (MSAs) with the worst unemployment rates in October 2018, 8 are in California, including El Centro MSA (Imperial County) which continues with Great Depression-era levels of unemployment that are 11 times worse than in San Mateo, the county with the lowest unemployment rate.
| wdt_ID | MSA | Unemp. | Rank (out of 389) |
|---|---|---|---|
| 1 | El Centro MSA | 21.2 | 389 |
| 2 | Visalia-Porterville MSA | 8.0 | 387 |
| 3 | Hanford-Corcoran MSA | 6.3 | 386 |
| 4 | Bakersfield MSA | 6.1 | 385 |
| 5 | Merced MSA | 5.8 | 382 |
| 6 | Fresno MSA | 5.8 | 382 |
| 7 | Madera MSA | 5.4 | 376 |
| 8 | Yuba City MSA | 5.2 | 366 |
Figure Source: US Bureau of Labor Statistics, October 2018 data
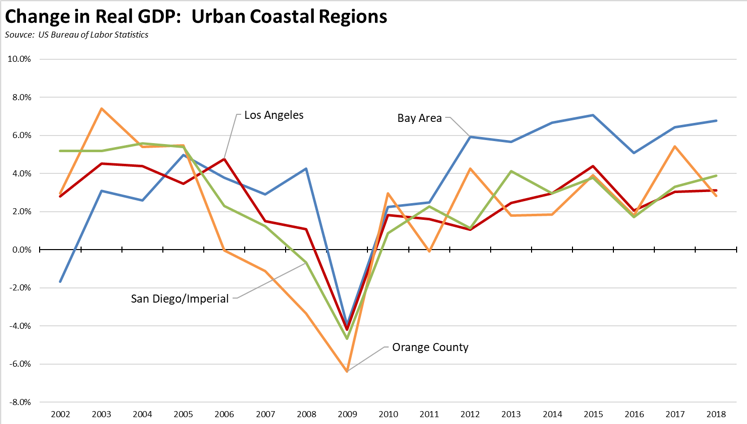
Chart of the Month: County GDP
Gross Domestic Product (GDP) previously was only available at the state and MSA level. Recently, US Bureau of Economic Analysis released the first estimates in their new series providing this information on a county level.
Looking first at the urban coastal regions, the Dot.Com recession at the beginning of this period along with its attendant plunge in state revenues was largely concentrated in the Bay Area. The more broadly based industry mix in the rest of the state saw less of an effect. Growth in the period following again was more balanced throughout the state, but with Orange County leading into the Great Recession period. Actual recession was short in both of the state’s two largest regions, but recovery was much slower within Los Angeles. The Bay Area since has moved well ahead of the other coastal centers.
The interior regions in general show more consistent GDP changes within this period, with the exception of the Central Coast which illustrates more variable growth as a result of this status along with its proximity to the Bay Area.
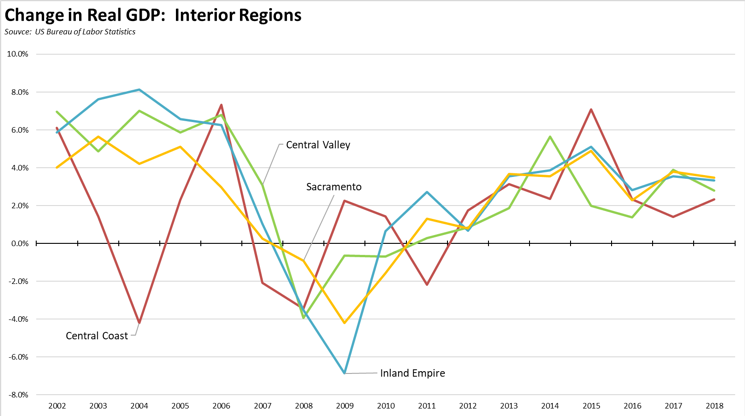
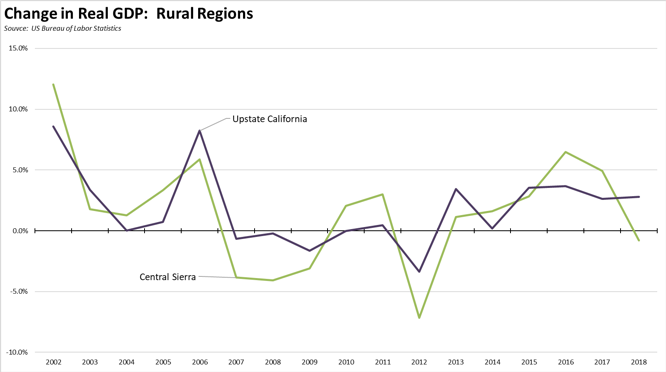
Finally, the two rural regions show more variable, although in general, lower overall growth in this period. These trends however also reflect that these counties are considerably smaller, and growth from year to year is more immediately affected by changes in major employers, water availability and agricultural prices, and influxes of primary and secondary home buyers.
The importance of the Bay Area to California’s economic performance is further shown by its increasing contribution to total state real GDP. With about 19% of total state population in this period, this region jumped from a growth contribution near its population share at the beginning of this period to more than twice as much in the recovery period.
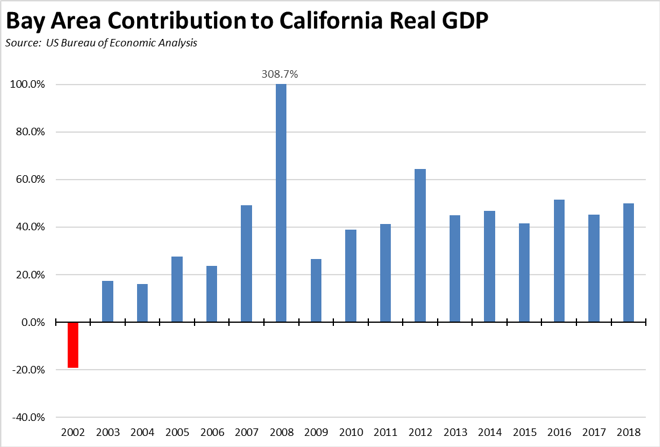
The consequent effect on the state’s relative economic performance is shown in the following table. Regardless of the period measured, the total numbers show California has outperformed the rest of the US. This situation, however, has followed from the outsized growth in the Bay Area, while the rest of the state has done little better than the other states combined. The current run of record state revenues similarly has been dependent on this disparate growth pattern as well, with the results at the beginning of this period illustrating the risks of putting all the budget eggs into one basket.