Highlights for policy makers:
- COVID-19 and the State Economy
- GDP Drops in Most Regions
- CaliFormer Businesses: Update
- Employment 868k Below Pre-Covid Level
- Labor Force Participation Rate
- Nonfarm Jobs: 826k Below Pre-Covid Level
- Jobs Change by Industry
- Employment Recovery by Region
- Unemployment Rates by Legislative Districts
- Unemployment Rates by Region
- MSAs with the Worst Unemployment Rates
COVID-19 and the State Economy
The overall results for November again show a disconnect between job reopenings and the number of workers reported as returning to employment, but with the outcomes reversed from last month. The change in nonfarm jobs at 45,700 was the lowest this year since the 80,000 loss posted in January. The change in employment at 79,900 was the highest since February when the second round of state-ordered closings first began to ease.
However, after improving in September as the federal unemployment benefits came to an end, the overall labor force since has remained essentially unchanged. The growth conditions still exist. Unfilled job openings as estimated by the new state-level Job Openings & Labor Turnover Survey (JOLTS) data continue to remain at series highs in California as elsewhere, with sufficient numbers to close the remaining gap with the pre-pandemic levels for nonfarm jobs. Labor supply as reflected in the labor force stagnation, however, continues to be a constraint on the ability to do so.
The continuing disconnect between the job and employment numbers is likely due to several factors. First, in a technical factor, the household survey used for the employment numbers may be producing more accurate information at the moment. Although the sample size overall is much larger, BLS indicates that the establishment survey used for the job numbers had the lowest response rate for a November in 13 years.
A second more structural issue is that a large share of households operated through the pandemic with significantly higher savings. Combined with lower consumption of services and delays for the purchase of many goods that remain in short supply, most households instead used substantial shares of the various pandemic period benefits to boost their savings, pay off debt, and invest in the stock market. Return to employment remains limited in some cases because pandemic payments were used to build financial cushions rather than provide immediate income support.
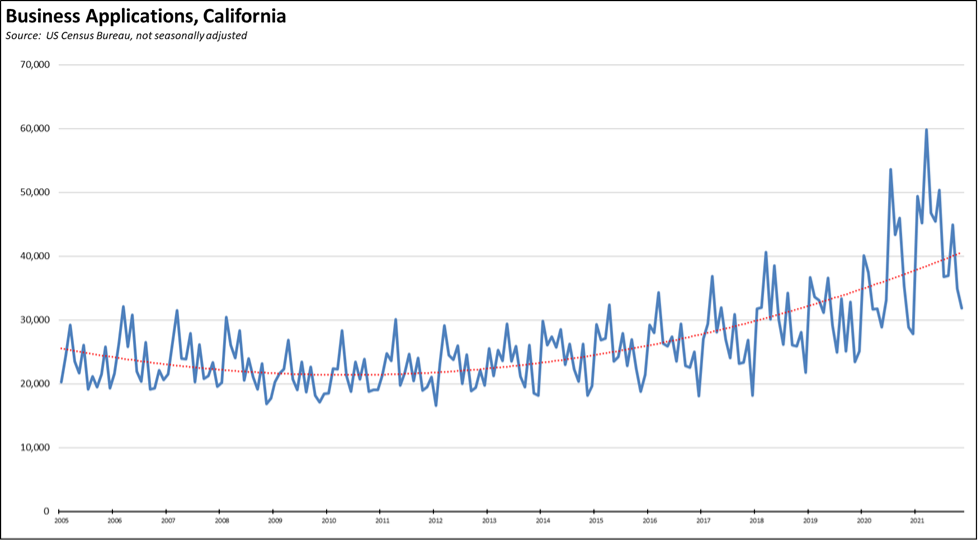
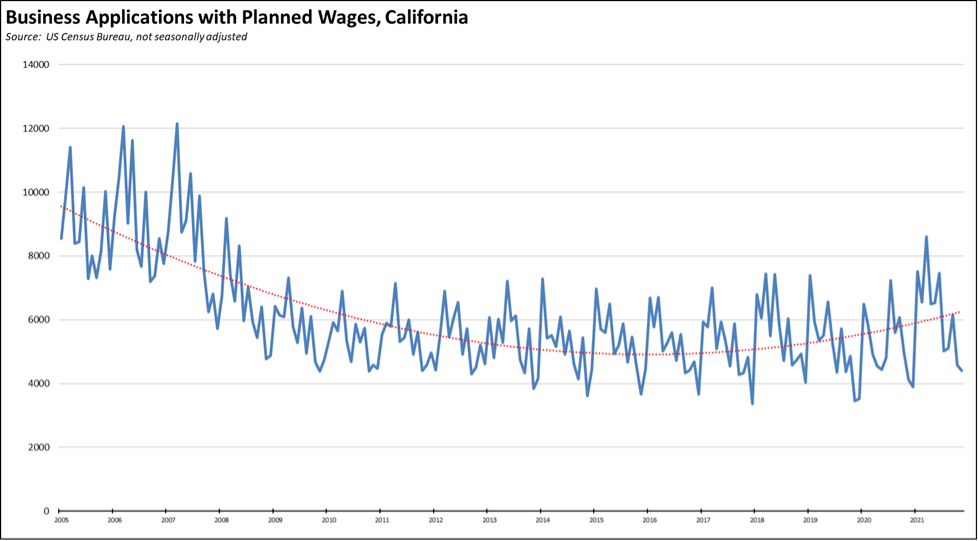
Third, workers are shifting to self-employment especially after having experienced several months of working at home or developing side businesses for income security. The most current business formation data from the Census Bureau show average monthly applications in 2021 coming in at 44% above the average in 2019. Applications with planned wages, however, are up 20% from the 2019 average and remain far off their levels in the period just before the Great Recession. Nationally, the numbers are higher, with all applications up 58% and applications with planned wages up 34%. New businesses not planning immediately for employees remains the dominant form in both cases—at 86% of the total in California and 88% nationally—but this form will continue to be at risk in California due to AB 5 (2019). This factor, however, will continue to help drive the employment numbers, especially in other states, as evidenced by the November results showing 12 states now above their pre-pandemic employment level.
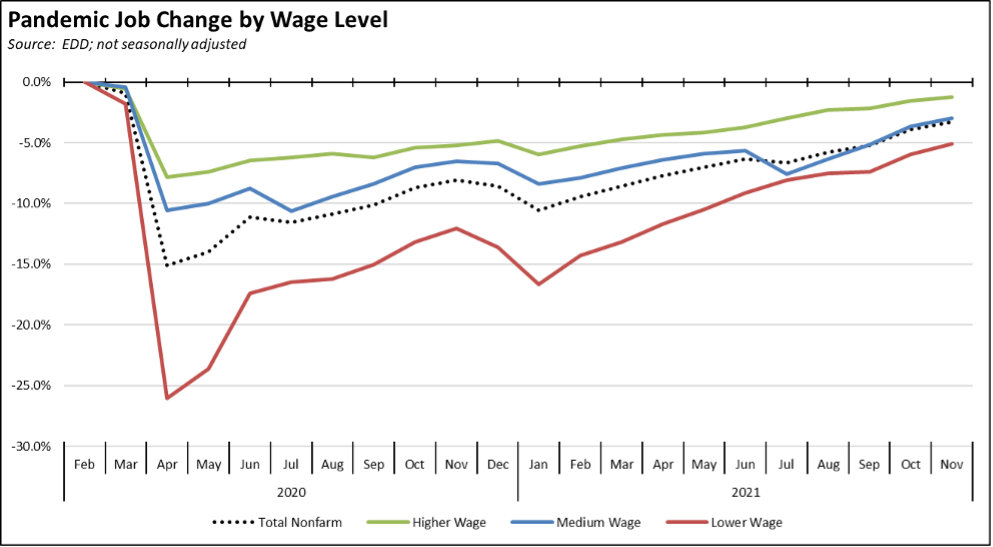
Using the more relevant unadjusted numbers, jobs by wage level showed improvement across all categories. Gains were strongest within the medium and lower wage industries as holiday hiring took hold and as Government continued to expand, but additional gains were in Transportation & Warehousing as efforts to resolve the current supply chain disruptions continue. Higher wage industries came in only 1.2% below the pre-pandemic level in February 2020.
In the chart, higher wage jobs are those industries with average annual wages above $100,000; medium wage is $50,000 to $100,000; and lower wage is below $50,000. Job data is drawn from the industry classifications, unadjusted job numbers, and wage levels generally used in the regular report section below on Nonfarm Jobs.
While most of the comparisons in this report and elsewhere measure recovery in terms of the pre-COVID levels in February 2020, the state lockdowns also shut off what was relatively strong growth in 2019. Full recovery consequently should instead be considered in how long it will take for the state to return to trend.
The weaker job numbers in November add to a slowing trend that if continued at this pace, would push recovery to trend out into 2024.
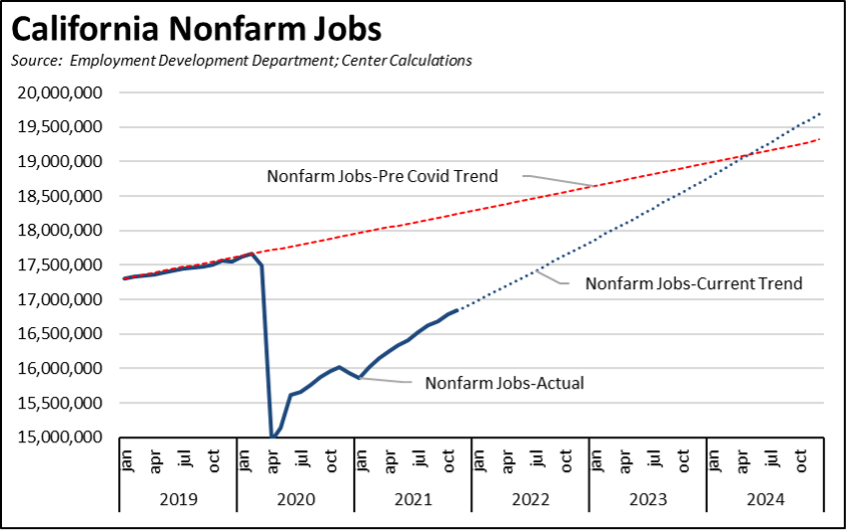
The somewhat higher employment numbers although not substantially improved over prior months would still move recovery to trend back to mid-2023 if future months continue at the current rate.
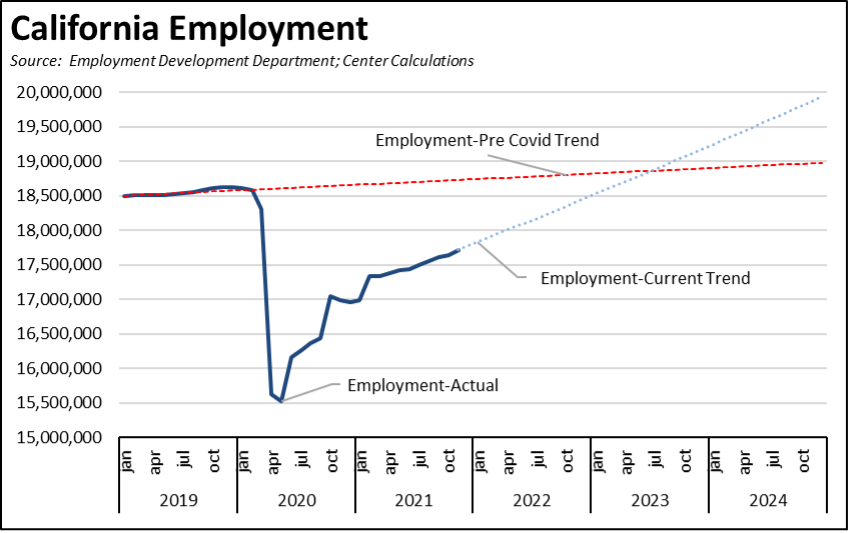
In both charts, the pre-Covid trend is taken from the average monthly growth rate between January 2019 and February 2020. The Current Trend lines are calculated using the numbers from the last 3 months.
As indicated by a comparison of the two pre-Covid trend lines, however, labor supply was on track to become a jobs constraint even prior to the pandemic. Some of this is definitional—at least some component of these trends in late 2019 and early 2020 was not due to the dynamics of the state economy, but instead is the result of regulatory restrictions as some self-employment was redefined to wage and salary or eliminated altogether to avoid legal risks created by AB 5. This element likely is still at play. But the bigger factor stemmed from the condition of the labor force participation rate, which remained well below both the levels prior to the Great Recession and recovery in the national levels as well. Many workers remained out of the workforce after that recession, especially older and youth workers, and many more remain out under the current conditions. And this hesitancy to re-enter came in spite of rising wages in both periods and was/has been more pronounced in California than in other states.
Labor supply was also subject to limits from two other key factors. First, in the recent 2020 American Community Survey, California again led the other states with the highest share of adults (age 25 and over) with less than a high school degree, at 15.6%. This level compares with the US at 10.6% and the second highest state, Texas, at 14.7%. As California’s economy increasingly becomes segmented into a two-tier structure of high-wage and low-wage jobs growth, the middle class wage opportunities being squeezed out by the state high tax, high regulation, and high cost policies also squeeze these workers out of upwardly mobile opportunities. Low skills remain a disconnect to better paying jobs within the state’s labor force, and the schools have yet to show the results required to remedy this situation.
Second, the core jobs engine remains the Bay Area and more specifically the high tech industry, and California schools continue to lag in preparing students—especially African-American, Latino, and male students—with the skills needed for these jobs. High tech consequently historically has relied on temporary visas to fill a substantial portion of their job needs. As remote work has become the norm, these workers no longer need to reside within the state. As Covid restrictions continue, immigration remains constrained. As immigrants choose more to move to other states and as an increasing share of current population does so as well due to ever rising costs, the labor supply becomes even more constrained. As the state’s population growth slows and becomes negative, so does growth in the labor force required to maintain the state’s economic dynamism, particularly as the population that remains continues to age rapidly out of prime working age.
GDP Drops in Most Regions
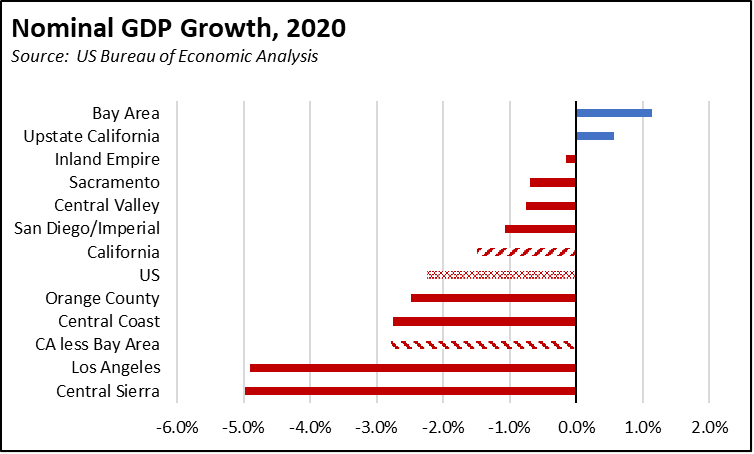
The recent Bureau of Economic Analysis release of the county GDP estimates for 2020 again reinforces the dominance of the Bay Area in California’s relative economic performance. Measured by nominal GDP, the Bay Area grew 1.1% during that pandemic year while almost all of the remaining parts of the state saw contractions. Growth rates ranged from 1.1% in the Bay Area as 4 of the 9 counties grew (led by Santa Clara County at 5.6%), to a loss of 4.9% in Los Angeles Region and 5.0% in Central Sierra.
For comparison, GDP contraction in California at 1.5% was somewhat better than the 2.2% in the US as a whole. However, California outside of the Bay Area experienced a greater loss at 2.8%.
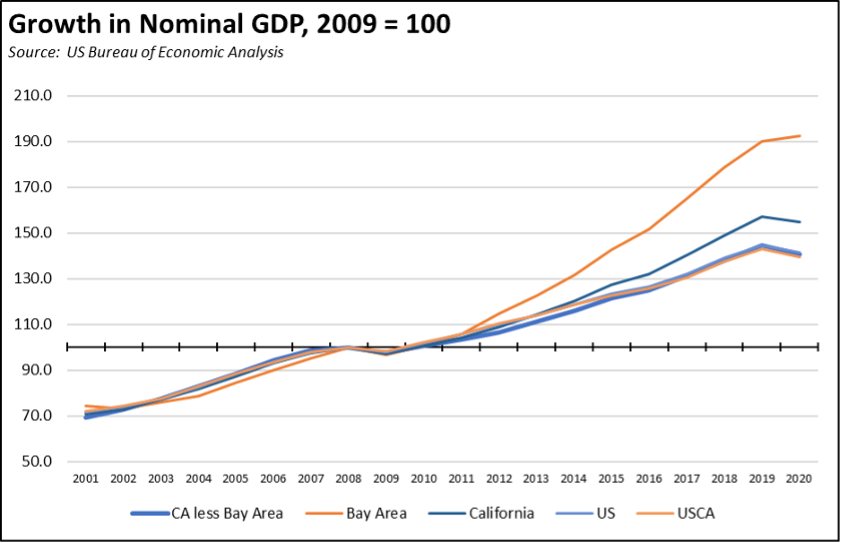
These results continue the longer term trend. In the chart below, GDP is indexed to 2008, California’s peak during the Great Recession. Because the prior Dot.Com Recession effects were largely limited to the Bay Area, that region lagged the rest of the state by a small amount in the years leading up to that point. Recovery from the Great Recession was quicker, with cumulative growth through 2020 at 127% higher than the rest of the state. Growth in California outside of the Bay Area has largely tracked the US, with cumulative growth through 2020 just slightly below.
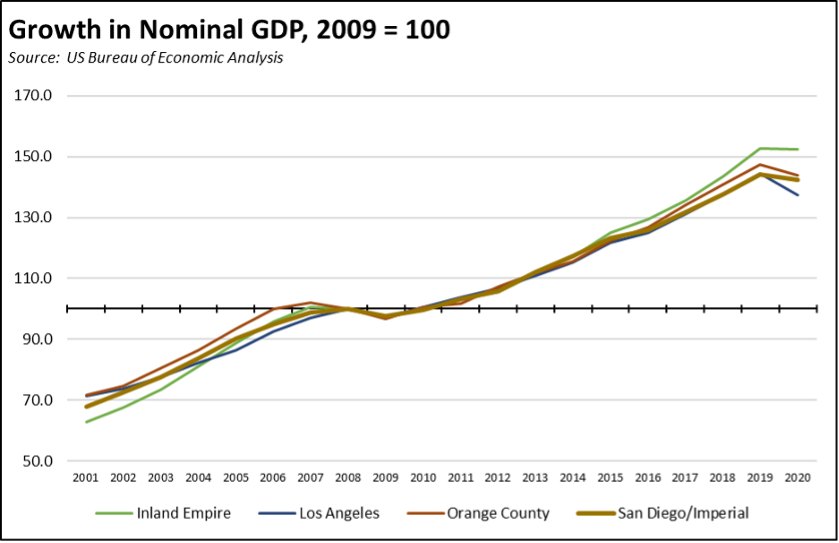
Within Southern California, Inland Empire went from the laggard to leader in this period. Los Angeles region at the other extreme experienced the sharpest drop from the state-ordered closures, ranking near the bottom of urban areas throughout this period when measured by the unemployment rate.
CaliFormer Businesses: Update
Additional CaliFormer companies identified since our last monthly report are shown below. Companies listed below include those that have announced: (1) moving their headquarters or full operations out of state, (2) moving business units out of state (generally back office operations where the employees do not have to be in a more costly California location to do their jobs), (3) California companies that expanded out of state, and (4) companies turning to permanent telework options, leaving it to their employees to decide where to work and live. The list is not exhaustive but is drawn from a monthly search of sources in key cities.
| wdt_ID | Companies | From | To | Reason | Source | Year |
|---|---|---|---|---|---|---|
| 167 | Chevron | San Ramon | Texas | Manufacturing expansion | Read More | 2021 |
| 168 | Embark Technology | San Francisco | Houston | Expansion | Read More | 2021 |
| 169 | Gordon Ramsay North America | Los Angeles | Texas | HQ move | Read More | 2021 |
| 170 | Planterra Foods | Lafayette | Denver | Manufacturing expansion | Read More | 2021 |
| 171 | Rubin Report | Los Angeles | Florida | Company move | Read More | 2021 |
| Companies | From | To | Reason | Source | Year |
In addition to companies, people continue to leave the state. In their most recent estimates, Department of Finance reported the first annual decline in the July 1 population for California, with a loss of 173,000 (0.4%). While media reports focused on the annual numbers, these estimates indicate a number of regions have been shrinking for a longer period of time:
- San Diego/Imperial (-16,766) and Central Sierra (-1,300) showed minor one-year declines.
- Bay Area (-67,020) and Central Coast (-8,170) had two-year declines.
- Orange County (-31,783) and Upstate California (-30,270) had three-year declines.
- Los Angeles region (-184,497) experienced the longest decline period at four years, with Los Angeles County alone showing a 169,683 loss in this period.
The other three regions—Central Valley, Inland Empire, and Sacramento—in contrast continued to grow, a combined 30,302 over the past year.
Population shifted downwards in part due to substantially slower natural increases as the number of births continued a long-term decline and as deaths rose above the prior upward trend. COVID-related deaths were at about 56,000, but deaths from other causes rose as well as the lockdowns also had other health effects including drug deaths and overall access to healthcare. “Excess deaths”—deaths above pre-pandemic three-year average but not attributable to a single cause—were up at least 20% in 7 counties, 10 to 20% in 23 counties, and at least 10% in 28 counties.
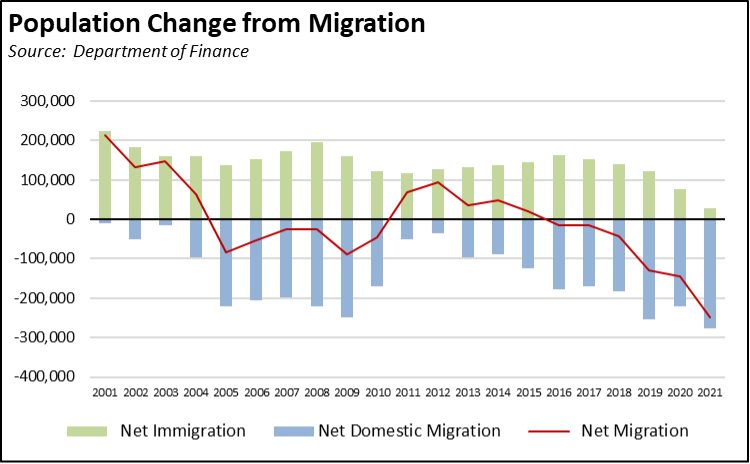
Increasing out-migration—household “Califormers”—also played an increasing role. Net domestic migration—the number leaving to other states less the number from other states moving here—reached its highest level since the beginning of the century. As indicated in the chart, California experienced a similar pattern of more people leaving prior to the Great Recession that began in 2008. That trend, however, was interrupted as the collapse in housing prices made it difficult for people to justify the move economically. Net migration began to grow as housing prices recovered, and has reached new levels even during the difficult conditions existing during the pandemic. Since 2001, California showed a total net loss of 3.1 million people from domestic migration, or the equivalent of 4 congressional seats.
In many years, however, the domestic migration losses were offset by foreign immigration. Net migration again turned negative in 2016 as these immigrants also found greater opportunities in other states with lower costs and better job opportunities for their skills and hopes of owning their own business. The number has been on a downward trend since, although somewhat accelerated in the pandemic period due to travel and visa restrictions and fewer foreign students in the state’s colleges and universities. In 2000, California was the home of 28% of the foreign-born population and 29% of those who were not naturalized citizens. In the latest results from the 2020 American Community Survey, those shares had dropped to 24% and 23%, respectively.
Employment 868k Below Pre-Covid Level
EDD reported that employment (seasonally adjusted; November preliminary) was up 79,900 from the revised October numbers, while the number of unemployed was down by 62,000. The recovery gains in November were somewhat stronger than in the prior 4 months, but only by enough to offset the dip in last month’s numbers. Overall and combining October and November for an average, employment recovery has deviated little from the average of about 56,000 since July.
The reported unemployment rate improved 0.4 point to 6.9% compared to 4.3% in February 2020 prior to the pandemic. With Nevada moving ahead, California had the highest unemployment rate among the states.
The national results were stronger, with total US employment rising 1,136,000, and the number of unemployed dropping 542,000. The reported unemployment rate improved 0.4 point to 4.2%, or withing striking distance of the 3.5% rate recorded in February 2020.
Figure Sources: California Employment Development Department; US Bureau of Labor Statistics
In the seasonally adjusted numbers, California employment remains 868,000 (4.7%) below the pre-pandemic level in February 2020; the rest of the states combined were 2.8% below. California went from 10th to 12th lowest ranked by employment recovery level, while 12 states were above the pre-pandemic February 2020 employment levels.
Labor Force Participation Rate
The labor force participation rate edged up 0.1 point to 61.2%, while the US number was up 0.2 point to 61.8%. The California rate remains well below the pre-pandemic level of 62.5%, which in turn was down substantially from prior years. Accounting for workers leaving the workforce since February 2020, there were 1.7 million out of work in November.
Nonfarm Jobs: 826k Below Pre-Covid Level
Nonfarm wage and salary jobs were up 45,700 (seasonally adjusted) in November, while gains in October saw a larger than usual adjustment up to 111,600 as the seasonal adjustment process continues to deal with the overwhelming pandemic factors.
California ranked third, behind Texas at 75,100 and Florida at 51,100. For the 12 months ending November—a measure that removes the distortion caused by the second round of state-ordered shutdowns at the end of last year—California saw nonfarm jobs rise by 5.1% while the other two states saw jobs up by 5.7%. In November, Texas also became the first large state to exceed its February 2020 jobs number.
Nonfarm wage and salary jobs in California were 25,800 short of the February 2020 numbers (seasonally adjusted) just prior to the pandemic, or 21.1% of the national shortfall.
California moved from 12th to 13th lowest rate of jobs recovery among the states. In the seasonally adjusted numbers, four states—Utah, Idaho, Texas, and Arizona—were above their pre-pandemic levels, moving from recovery to growth.
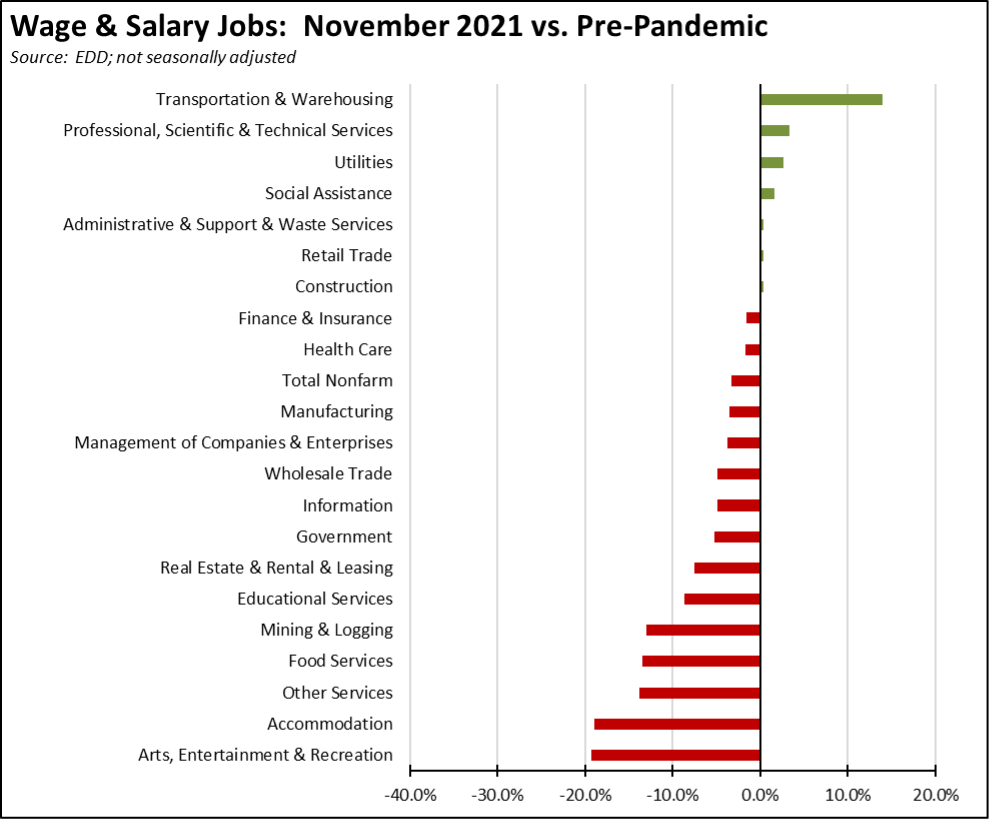
Jobs Change by Industry
Using the unadjusted numbers that allow a more detailed look at industry shifts, the number of industries showed job levels at or exceeding the pre-pandemic February 2020 levels edged up to 7. Transportation & Warehousing by a substantial margin shows the strongest growth as companies continue to battle the ongoing supply chain disruptions. The biggest lags in recovery continue to the those lower-wage industries that were hardest hit by the state-ordered closures: Arts, Entertainment & Recreation, Accommodation, Other Services, and Food Services.
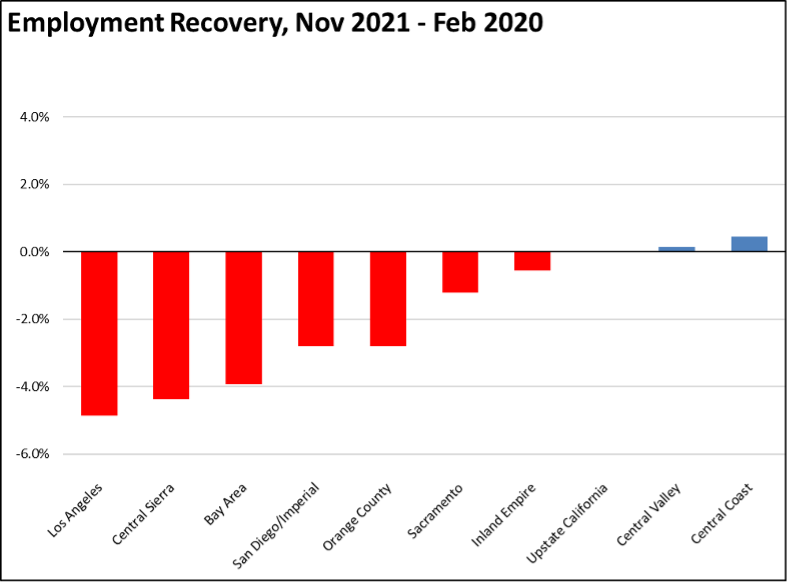
Employment Recovery by Region
Comparing November employment to pre-pandemic February 2020, Los Angeles Region lagged behind the rest of the state, showing a loss of 4.9% and containing 50% of the total employment shortfall in the state compared to 29% of the total population. Central Coast and Central Valley are in the growth category.
Unemployment Rates by Legislative Districts
The highest and lowest estimated unemployment rates in November are shown below.
Lowest
Highest
Unemployment Rates by Region
Unemployment rates (not seasonally adjusted) compared to pre-pandemic February 2020 show Los Angeles Region remaining the second worst in the state. Sacramento and Central Coast came close to the pre-pandemic unemployment rates. Los Angeles and Bay Area regions were the next closest, within 1 percentage point, with Los Angeles region at the stage only because unemployment was already high going into the pandemic period.
| wdt_ID | Region | November - 21 | February - 20 |
|---|---|---|---|
| 2 | California | 5.4 | 4.3 |
| 6 | Bay Area | 3.7 | 2.7 |
| 10 | Orange County | 4.1 | 7.0 |
| 14 | Sacramento | 4.6 | 4.6 |
| 18 | Central Sierra | 4.9 | 4.5 |
| 22 | Central Coast | 4.9 | 8.4 |
| 26 | San Diego/Imperial | 5.0 | 2.8 |
| 30 | Upstate California | 5.3 | 3.9 |
| 34 | Inland Empire | 5.4 | 3.7 |
| 38 | Los Angeles | 6.8 | 6.3 |
| 39 | Central Valley | 7.1 | 3.8 |
Figure Source: California Employment Development Department
MSAs with the Worst Unemployment Rates
California edged up to 12 of the MSAs among the 25 regions with the worst unemployment rates in October, including El Centro MSA (Imperial County) with the worst unemployment rate in the nation. Los Angeles-Anaheim tied with 4 other MSAs for the 17th worst rate.
| wdt_ID | MSA | September Unemployment Rate | US Rank out of 389 |
|---|---|---|---|
| 1 | El Centro MSA | 17.7 | 389 |
| 2 | Visalia-Porterville MSA | 9.2 | 387 |
| 3 | Bakersfield MSA | 8.3 | 386 |
| 4 | Merced MSA | 8.0 | 385 |
| 5 | Hanford-Corcoran MSA | 7.9 | 383 |
| 6 | Fresno MSA | 7.6 | 379 |
| 7 | Madera MSA | 7.3 | 378 |
| 8 | Stockton-Lodi MSA | 7.2 | 377 |
| 9 | Los Angeles-Long Beach-Anaheim MSA | 7.1 | 373 |
| 10 | Yuba City MSA | 6.9 | 370 |
| 11 | Modesto MSA | 6.9 | 370 |