Highlights for policy makers:
- Unemployment Rate Declines to 5.8%; Total Employment Rises 15,400
- State Employment Growth Rankings
- Labor Force Participation Rate Declines to 62.1%–Another New Low
- Nonfarm Jobs Increase 41,200
- Six Industries Remain Below 2007 Pre-Recession Job Levels
- Three Counties in Double-Digit Unemployment; One-Quarter are 5% or Less
- Six California MSAs in Nation’s 10 Worst Unemployment Rates
- Two-Tier Economy Persists
- Bay Area Continues to Dominate Employment Growth
- Per Capita Personal Income Up 3.9% in 2014
Unemployment Rate Declines to 5.8%; Total Employment Rises 15,400
The Labor Force data for October 2015 (seasonally adjusted; California preliminary) is shown below, along with the change from the prior month:
| Seasonally Adjusted | California | US | ||
|---|---|---|---|---|
| Oct 2015 | Change from Sept 2015 | Oct 2015 | Change from Sept 2015 | |
| Unemployment Rate | 5.8% | -0.1 | 5.0% | -0.1 |
| Labor Force | 18,993,600 | -0.1% | 157,028,000 | -0.2% |
| Participation Rate | 62.2% | -0.1 | 62.4% | 0.0 |
| Employment | 17,898,800 | 0.1% | 149,120,000 | 0.2% |
| Unemployment | 1,094,700 | -2.4% | 7,908,000 | -0.1% |
The related not seasonally adjusted numbers (California preliminary), with the change from October 2014:
| Not Seasonally Adjusted | California | US | ||
|---|---|---|---|---|
| Oct 2015 | Change from Oct 2014 | Oct 2015 | Change from Oct 2014 | |
| Unemployment Rate | 5.7% | -1.3 | 4.8% | -0.7 |
| Labor Force | 19,017,200 | 0.4% | 157,313,000 | 0.4% |
| Participation Rate | 62.2% | -0.4 | 62.5% | -0.5 |
| Employment | 17,936,900 | 1.8% | 149,716,000 | 1.2% |
| Unemployment | 1,080,400 | -18.4% | 7,597,000 | -12.5% |
California Employment Development Department’s (EDD) latest release shows on a seasonally adjusted basis, total employment grew by 15,400 from September, while the number of unemployed dropped by 26,500. California’s seasonally adjusted unemployment rate declined from 5.9% in September to 5.8% in October. The unadjusted rate decreased from 7.0% in October 2014 to 5.7% in October 2015.
Total US employment saw a seasonally adjusted increase of 320,000, while the number of unemployed declined slightly by 7,000.
California’s improved unemployment rate in the seasonally adjusted series continues to benefit from a drop in the labor force, a net decrease of 11,000 from the prior month.
California’s seasonally adjusted unemployment rate was 16.0% higher than the national rate. California had the 11th highest unemployment rate among the states (including DC).
State Employment Growth Rankings
| Rank | Number of Employed | Percentage Change | Population Adjusted (employment growth per 1,000 civilian noninstitutional population) |
|---|---|---|---|
| 1 | CA 381,218 | MS 6.3% | MS 31.2 |
| 2 | NY 192,158 | ID 3.8% | ID 22.9 |
| 3 | NC 124,146 | SC 3.2% | NV 18.6 |
| 4 | TN 88,798 | TN 3.2% | RI 18.1 |
| 5 | IN 71,193 | NV 3.2% | OK 18.0 |
| 6 | MS 70,945 | OK 3.1% | SC 17.5 |
| 7 | MI 70,895 | AR 3.0% | TN 17.3 |
| 8 | SC 66,132 | RI 3.0% | DC 17.1 |
| 9 | MD 65,551 | NC 2.8% | AR 16.4 |
| 10 | IL 63,381 | DE 2.8% | DE 16.4 |
| 11 | PA 60,213 | DC 2.6% | NC 16.1 |
| 12 | AZ 54,205 | IN 2.3% | UT 14.0 |
| 13 | OK 53,318 | MD 2.2% | MD 14.0 |
| 14 | WA 50,772 | CA 2.2% | IN 13.9 |
| 15 | GA 46,733 | NY 2.1% | MT 12.9 |
| 16 | NV 41,216 | UT 2.1% | CA 12.6 |
| 17 | AR 37,549 | MT 2.1% | NY 12.2 |
| 18 | NJ 33,324 | AZ 1.9% | HI 10.9 |
| 19 | UT 29,540 | HI 1.8% | AZ 10.4 |
| 20 | ID 28,308 | MI 1.6% | WA 9.2 |
| US 1,860,000 | US 1.3% | US 7.4 |
Between October 2014 and October 2015, Bureau of Labor Statistics (BLS) data shows the total number of employed in California increased by 381,218 (seasonally adjusted), or 20.5% of the total net employment gains in this period for the US. Measured by percentage change in employment over the year, California declined from 13th to 14th highest. Adjusted for population, California dropped from 14th to 16th.
Labor Force Participation Rate Remains at 62.1%–Another New Low
California’s participation rate (seasonally adjusted) declined another 0.1% to 62.1%. The comparable US rate remained steady at 62.4%.
California’s seasonally adjusted labor force participation rate continues to drop below the previous lows recorded in 1976. This latest decline trend since February 2013 has been a key factor in the improvement in the state’s unemployment rate, as persons have left the labor force and are no longer counted among the unemployed. As indicated in previous months’ reports, the continuing decline in labor force participation is a structural change producing comparatively fewer income earners per household. As some households thereby face lower total income, the ability to afford housing is reduced, and the relative incidence of cost-of-living adjusted poverty is increased. Continuing declines in the number of income earners relative to the economy further has long term implications to the stability of public revenues and demand on public services.
Nonfarm Jobs Increase 41,200
EDD reported that between September and October 2015, seasonally adjusted nonfarm payroll jobs increased by 41,200. The September job gains were revised upwards to 21,100 from the preliminary estimate of 8,200.
Looking at the not seasonally adjusted numbers, the change in nonfarm payroll jobs from September 2015 saw the largest increases in Government (66,300) and Educational Services (22,300) as schools completed staffing up for the academic year, Retail Trade (17,800), Professional, Technical & Scientific Services (16,000), and Health Care & Social Assistance (11,200). Biggest declines were in Farm (-15,900), Manufacturing (-13,400), and Arts, Entertainment & Recreation (-4,100).
| Not Seasonally Adjusted Payroll Jobs | Sep 2015 | Oct 2015 | Change Oct 2015 – Sep 2015 | Change Oct 2015 – Oct 2014 |
|---|---|---|---|---|
| Total Farm | 473,400 | 457,500 | -15,900 | 7,400 |
| Mining & Logging | 29,500 | 29,500 | 0 | -2,400 |
| Construction | 746,000 | 751,000 | 5,000 | 50,900 |
| Manufacturing | 1,288,300 | 1,274,900 | -13,400 | -3,200 |
| Wholesale Trade | 741,000 | 744,900 | 3,900 | 19,300 |
| Retail Trade | 1,664,200 | 1,682,000 | 17,800 | 34,100 |
| Transportation, Warehousing & Utilities | 548,900 | 551,900 | 3,000 | 17,000 |
| Information | 479,100 | 478,400 | -700 | 13,700 |
| Finance & Insurance | 519,400 | 520,300 | 900 | 200 |
| Real Estate & Rental & Leasing | 275,000 | 274,400 | -600 | 7,100 |
| Professional, Scientific & Technical Services | 1,265,200 | 1,281,200 | 16,000 | 74,300 |
| Management of Companies & Enterprises | 231,600 | 232,900 | 1,300 | 7,600 |
| Administrative & Support & Waste Services | 1,094,200 | 1,103,400 | 9,200 | 47,700 |
| Educational Services | 354,000 | 376,300 | 22,300 | 3,200 |
| Health Care & Social Assistance | 2,139,200 | 2,150,400 | 11,200 | 69,500 |
| Individual & Family Services | 587,600 | 588,700 | 1,100 | 9,300 |
| Arts, Entertainment, & Recreation | 288,200 | 284,100 | -4,100 | 9,400 |
| Accommodation & Food Service | 1,559,000 | 1,567,500 | 8,500 | 73,000 |
| Other Services | 550,600 | 553,300 | 2,700 | 7,000 |
| Government | 2,417,200 | 2,483,500 | 66,300 | 35,400 |
| Total Nonfarm | 16,190,600 | 16,339,900 | 149,300 | 463,800 |
| Total Wage & Salary | 16,664,000 | 16,797,400 | 133,400 | 471,200 |
By total number of new jobs, California had the highest increase in seasonally adjusted nonfarm jobs among the states from October 2014 to October 2015, at 463,000 or 16.5% of the US net increase. By percentage growth in jobs, California remained at 6th highest, and by population adjusted jobs growth, went from 8th to 5th highest.
| Rank | Number of Jobs | Percentage Change | Population Adjusted (job growth per 1,000 civilian noninstitutional population) |
|---|---|---|---|
| 1 | CA 463,000 | ID 3.8% | UT 22.0 |
| 2 | FL 239,900 | UT 3.5% | ID 20.1 |
| 3 | TX 203,900 | NV 3.4% | NV 18.6 |
| 4 | NY 164,000 | FL 3.0% | WA 16.5 |
| 5 | GA 97,100 | WA 3.0% | CA 15.1 |
| 6 | WA 92,800 | CA 2.9% | SC 14.9 |
| 7 | NC 91,000 | SC 2.9% | FL 14.7 |
| 8 | MA 80,600 | OR 2.7% | MA 14.6 |
| 9 | MI 79,600 | MA 2.4% | OR 14.4 |
| 10 | OH 77,400 | AZ 2.3% | DC 14.1 |
| US 2,814,000 | US 2.0% | US 11.2 |
Six Industries Remain Below 2007 Pre-Recession Job Levels
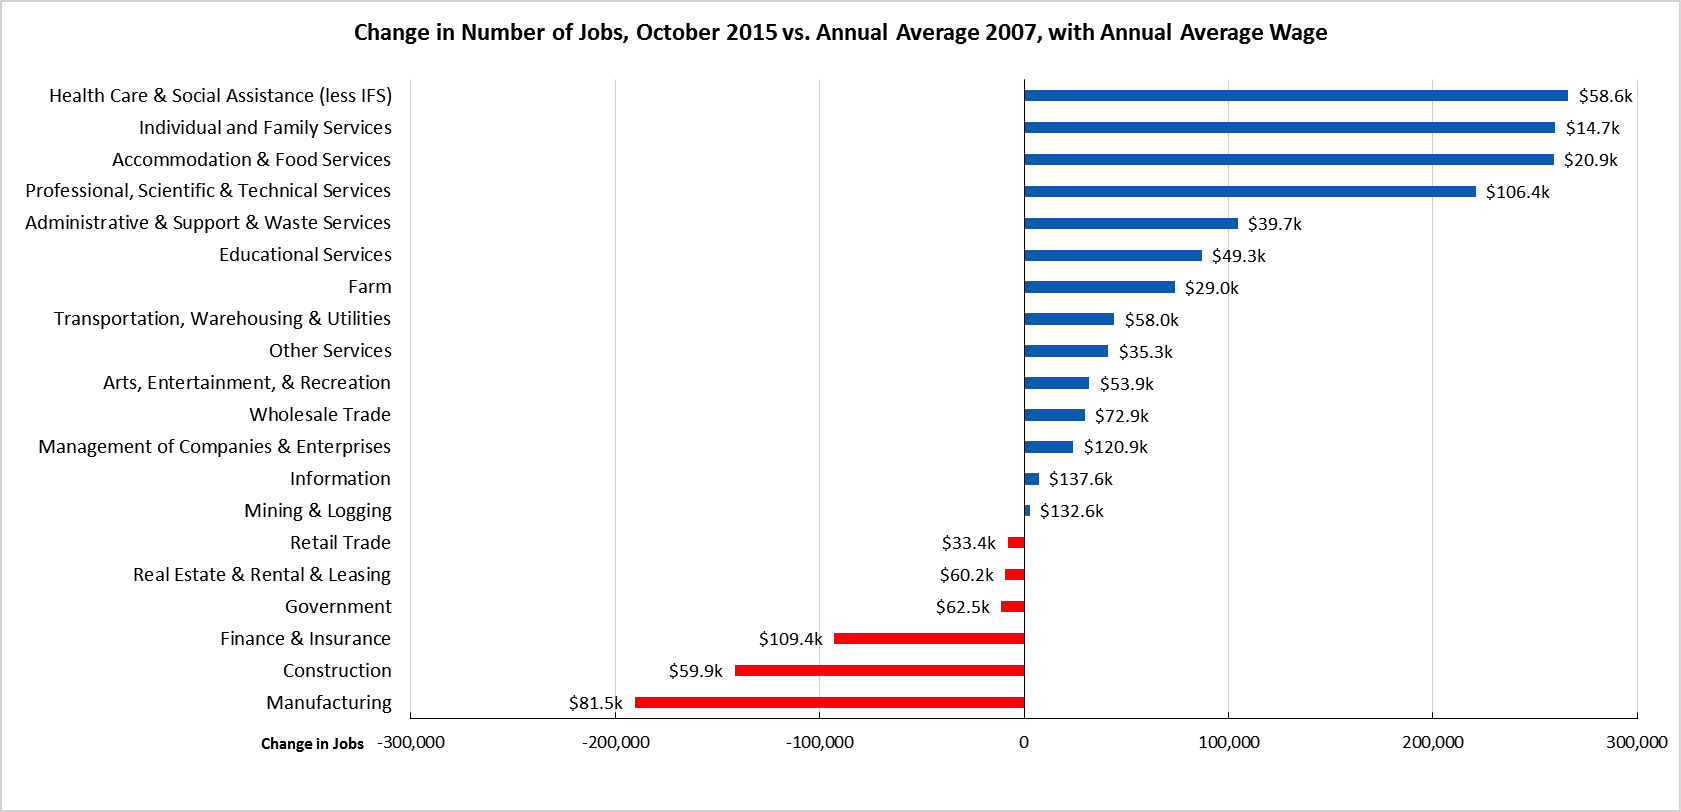
Comparing the number of jobs by industry in October 2015 (not seasonally adjusted), 6 industries remain below the 2007 pre-recession levels. Net job growth continues to be dominated by two higher wage and the two lowest wage industries.
Three Counties in Double-Digit Unemployment, One-Quarter are 5% or Less

Six California MSAs in Nation’s 10 Worst Unemployment Rates
In the BLS ranking of the nation’s 387 Metropolitan Statistical Areas (MSA) by October 2015 unemployment rate, 6 California MSAs rank in the bottom 10, and 10 California MSAs were in the bottom 20.
| US Rank | MSA | Unemployment Rate, Sep 2015 |
|---|---|---|
| 377 | Atlantic City-Hammonton, NJ MSA | 8.0% |
| 377 | Rocky Mount, NC MSA | 8.0% |
| 379 | Fresno, CA MSA | 8.1% |
| 379 | Hanford-Corcoran, CA MSA | 8.1% |
| 379 | Vineland-Bridgeton, NJ MSA | 8.1% |
| 382 | Merced, CA MSA | 8.2% |
| 383 | Bakersfield, CA MSA | 8.4% |
| 383 | Lake Havasu City-Kingman, AZ MSA | 8.4% |
| 385 | Visalia-Porterville, CA MSA | 9.9% |
| 386 | El Centro, CA MSA | 21.6% |
| 387 | Yuma, AZ MSA | 26.0% |
The highest ranked California MSA—Napa MSA—tied with 8 other MSAs nationally at rank 63 with an unemployment rate of 3.6%.
Two-Tier Economy Persists
Unemployment rates (all data is not seasonally adjusted) continue to vary widely across the state, ranging from 4.1% in the Bay Area to more than double at 9.0% in the Central Valley.
| Not Seasonally Adjusted | Unemployment Rate (%) October 2015 |
|---|---|
| California | 5.7 |
| Bay Area | 4.1 |
| Orange County | 4.3 |
| Central Coast | 5.4 |
| Sacramento Region | 5.5 |
| San Diego/Imperial | 5.8 |
| Los Angeles | 5.8 |
| Central Sierra | 6.2 |
| Inland Empire | 6.3 |
| Upstate California | 6.7 |
| Central Valley | 9.0 |
Ratio of Highest to Lowest Rate: 2.20
By County:
| Lowest 3 Unemployment Rates | |
|---|---|
| San Mateo County | 3.2 |
| Marin County | 3.3 |
| San Francisco County | 3.4 |
| Highest 3 Unemployment Rates | |
|---|---|
| Colusa County | 10.8 |
| Tulare County | 10.8 |
| Imperial County | 21.8 |
Ratio of Highest to Lowest Rate: 6.81
By Legislative District:
| Lowest 10 Unemployment Rates | |||
|---|---|---|---|
| SD 13 (Hill – D) | 3.0 | AD 22 (Mullin – D) | 3.0 |
| SD 11 (Leno – D) | 3.5 | AD 16 (Baker – R) | 3.1 |
| SD 37 (Moorlach – R) | 3.6 | AD 24 (Gordon – D) | 3.1 |
| SD 39 (Block – D) | 4.1 | AD 28 (Low – D) | 3.3 |
| SD 15 (Beall – D) | 4.1 | AD 19 (Ting – D) | 3.5 |
| SD 36 (Bates – R) | 4.1 | AD 17 (Chiu – D) | 3.5 |
| SD 07 (Glazer – D) | 4.3 | AD 77 (Maienschein – R) | 3.5 |
| SD 10 (Wieckowski – D) | 4.4 | AD 74 (Harper – R) | 3.6 |
| SD 02 (McGuire – D) | 4.4 | AD 73 (Brough – R) | 3.6 |
| SD 26 (Allen – D) | 4.5 | AD 68 (Wagner – R) | 3.6 |
| Highest 10 Unemployment Rates | |||
|---|---|---|---|
| SD 21 (Runner – R) | 6.8 | AD 34 (Grove – R) | 7.3 |
| SD 33 (Lara – D) | 6.9 | AD 36 (Lackey – R) | 7.6 |
| SD 24 (de León – D) | 6.9 | AD 23 (Patterson – R) | 8.0 |
| SD 35 (Hall – D) | 7.0 | AD 13 (Eggman – D) | 8.6 |
| SD 08 (Berryhill – R) | 7.8 | AD 64 (Gibson – D) | 8.6 |
| SD 05 (Galgiani – D) | 8.0 | AD 21 (Gray – D) | 9.7 |
| SD 16 (Fuller – R) | 8.0 | AD 26 (Mathis – R) | 10.5 |
| SD 12 (Cannella – R) | 8.4 | AD 32 (Salas – D) | 10.8 |
| SD 40 (Hueso – D) | 9.5 | AD 31 (Perea – D) | 10.9 |
| SD 14 (Vidak – R) | 11.6 | AD 56 (Garcia – D) | 13.1 |
Ratio of Highest to Lowest Rate: Senate 3.81
Ratio of Highest to Lowest Rate: Assembly 4.42
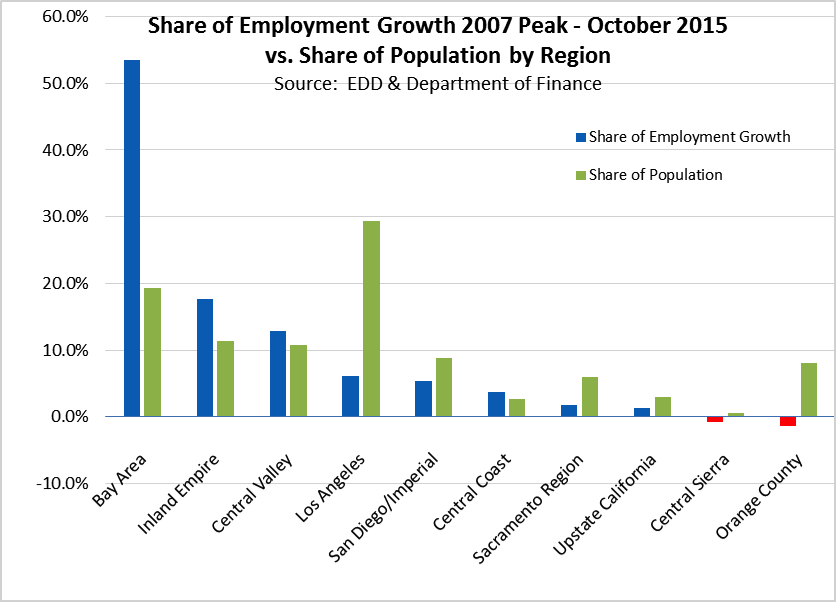
Bay Area Continues to Dominate Employment Growth
Bay Area continues to dominate employment growth in the state, capturing 53.5% of the state’s net employment growth since the 2007 pre-recession peak (November 2007), while containing only 19.4% of the state population. Both Inland Empire and Central Valley show employment growth shares that are larger relative to their share of the population, with Inland Empire increasing its share of net employment growth from 16.4% in September to 17.6% in October while the Central Valley’s share dropped primarily due to seasonal factors. Los Angeles Region with 29.4% of the population, contains only 6.1% of the state’s net employment growth since the pre-recession peak.
Per Capita Personal Income Up 3.9% in 2014
US Bureau of Economic Analysis (BEA) released personal income data for 2014 covering counties and other sub-state areas, along with revisions to the data series back to 1969. The revised data shows per capita personal income for California grew 3.9% to $49,985 in 2014, compared with 3.7% growth to $46,459 for the US average. Total personal income in California grew 4.9% in 2014, compared to 4.4% for the US total.
All but two counties showed per capita personal income growth in 2014, ranging from -5.9% in Colusa County to 8.8% in Sierra County. Per capita personal income in 2014 ranged from $30,437 in Del Norte County to $98,626 in Marin County.
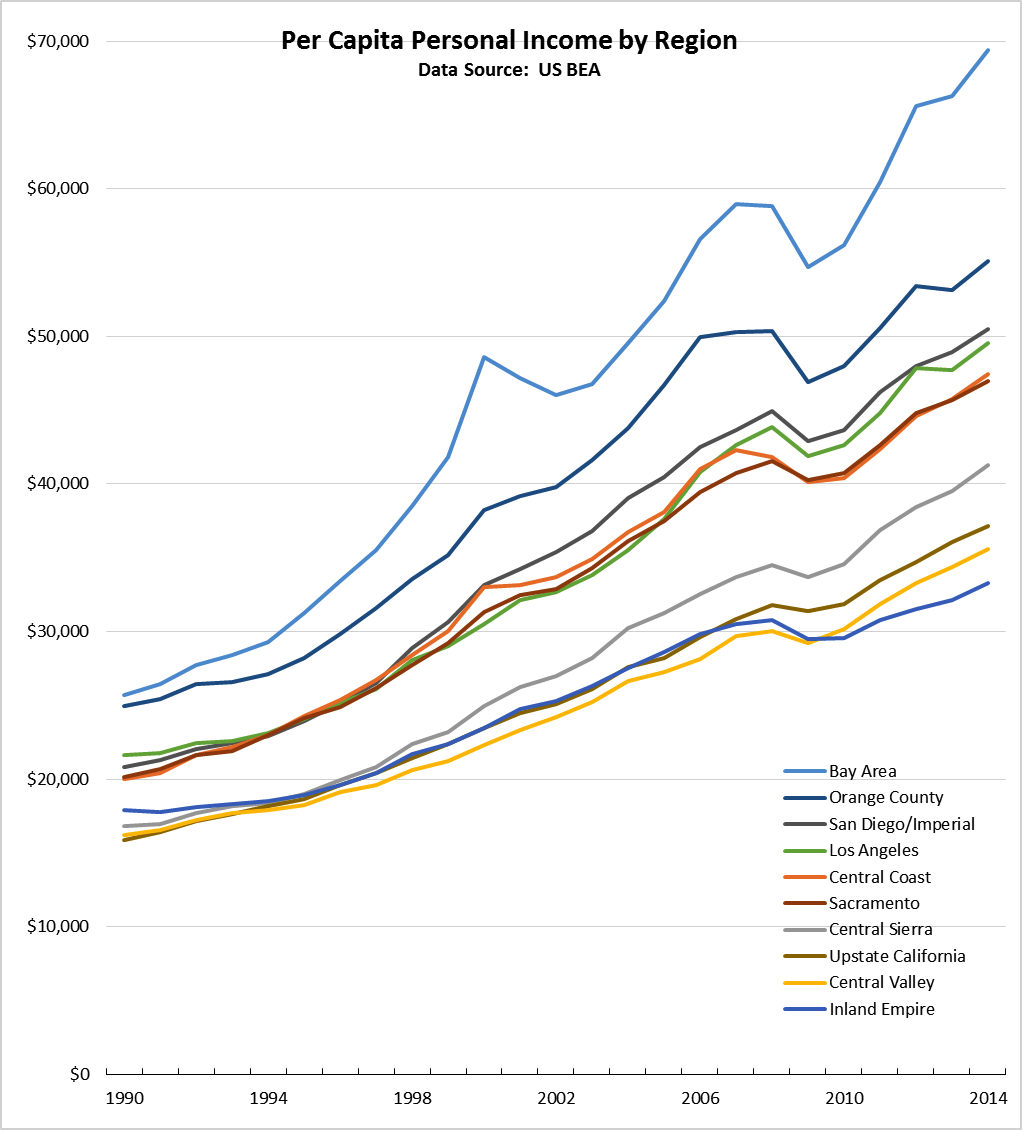
Per capita personal income growth by region in shown in the following graph. All ten regions experienced per capita personal income growth in 2014, ranging from 2.9% in Sacramento Region to 4.7% in the Bay Area. Per capita personal income ranged from $33,258 in the Inland Empire, to $69,402 in the Bay Area. The Bay Area accounted for one-third (33.3%) of the net growth in total California personal income, followed by Los Angeles Region at 26.6%.
More importantly, rather than a two-tier economic recovery, the graph below suggests that when ranked by income levels, the state instead has evolved into three distinct areas. While the state began the 1990s with three income groupings of lower, middle, and higher per capita incomes, the Bay Area has leapt ahead into a category by itself. The Bay Area is now at nearly 40% higher than the state average; 5 regions are grouped at plus or minus 10% of the state average (Orange County, San Diego/Imperial, Los Angeles, Central Coast, Sacramento); while the remaining 4 lie up to one-third below.
The data revisions from 1969 in general produced lower numbers for both total and per capita personal income for most counties and regions. The primary exceptions were the Bay Area and Los Angeles Region which saw upward adjustments in most years.
Additional detail for the state, counties, and regions have been updated to the Center’s Economic Indicators section. Personal income estimates for the Legislative Districts will be updated after the income factors from the American Community Survey become available next month.
Note: All data sources, methodologies, and historical data series available at CenterforJobs.org.