Highlights for policy makers:
- Unemployment Rate Remains at 5.5%; Total Employment Up 90,900
- Labor Force Participation Rate Improves to 62.8%
- State Employment Growth Rankings
- Nonfarm Jobs Increase 31,200
- Four Industries below 2007 Pre-Recession Job Levels
- Two-Tier Economy Persists
- Seven California MSAs in the 10 Worst Unemployment Rates Nationally
- California in Full Employment?
- 3rd Quarter Housing Permits Down 1%
- 3rd Quarter Housing Prices 60.6% Above US Average
Unemployment Rate Remains at 5.5%; Total Employment Up 90,900
The Labor Force data for October 2016 (seasonally adjusted; California preliminary) is shown below, along with the change from the prior month:
| Seasonally Adjusted | California | US | ||
|---|---|---|---|---|
| Oct 2016 | Change from Sep 2016 | Oct 2016 | Change from Sep 2016 | |
| Unemployment Rate | 5.5 | 0 | 4.9 | -0.1 |
| Labor Force | 19,438,000 | 0.5% | 159,712,000 | -0.1% |
| Participation Rate | 62.8 | 0.2 | 62.8 | -0.1 |
| Employment | 18,368,700 | 0.5% | 151,925,000 | 0.0% |
| Unemployment | 1,069,300 | -0.1% | 7,787,000 | -1.9% |
The related not seasonally adjusted numbers (California preliminary), with the change from October 2015:
| Not Seasonally Adjusted | California | US | ||
|---|---|---|---|---|
| Oct 2016 | Change from Oct 2015 | Oct 2016 | Change from Oct 2015 | |
| Unemployment Rate | 5.3 | -0.5 | 4.7 | -0.1 |
| Labor Force | 19,463,400 | 2.5% | 159,783,000 | 1.6% |
| Participation Rate | 62.9 | 0.9 | 62.8 | 0.3 |
| Employment | 18,432,400 | 3.0% | 152,335,000 | 1.7% |
| Unemployment | 1,031,100 | -5.8% | 7,447,000 | -2.0% |
California Employment Development Department’s (EDD) latest release shows on a seasonally adjusted basis, total employment grew by 90,900 from September, while the number of unemployed essentially remained level with a decline of only 1,300. California’s seasonally adjusted unemployment rate remained steady from the prior three months at 5.5%. California tied with Nevada and Rhode Island for the 10th highest unemployment rate among the states. The unadjusted rate dropped from 5.8% in October 2015 to 5.3%.
Total US employment saw a seasonally adjusted decrease of 43,000 from September, while the number of unemployed dropped by 152,000. The national unemployment rate eased marginally to 4.9%.
Labor Force Participation Rate Improves to 62.8%
California’s participation rate (seasonally adjusted) rose 0.2 point to 62.8% in October, matching for the first time since a brief period in 2010, the comparable US average which eased marginally by 0.1 point to 62.8%. The California participation rate has now shown improvement over the past four months, but has yet to rebound to levels that would constitute recovery. The overall rate still remains near the previous lows from 1976, and well below the average pre-recession level of 65.6% in 2007.
State Employment Growth Rankings
| Rank | Number of Employed | Percentage Change | Population Adjusted (employment growth per 1,000 civilian noninstitutional population) |
|---|---|---|---|
| 1 | CA 517,200 | OR 5.2% | OR 30.1 |
| 2 | TX 232,100 | TN 4.7% | TN 26.2 |
| 3 | GA 183,500 | GA 4.1% | GA 23.5 |
| 4 | FL 152,000 | WA 3.7% | ND 22.8 |
| 5 | TN 135,600 | ND 3.3% | WA 21.9 |
| 6 | WA 123,700 | AZ 3.2% | CO 19.6 |
| 7 | NC 113,000 | KY 3.1% | MA 18.3 |
| 8 | MI 101,700 | CO 3.1% | AZ 18.2 |
| 9 | MA 100,800 | MA 3.0% | UT 17.9 |
| 10 | OR 97,400 | CA 2.9% | CA 16.9 |
| 11 | AZ 96,300 | SC 2.8% | IN 16.7 |
| 12 | IN 85,700 | IN 2.7% | KY 16.4 |
| 13 | CO 83,500 | UT 2.7% | NH 16.2 |
| 14 | IL 60,700 | ME 2.7% | ME 16.0 |
| 15 | SC 59,300 | NC 2.5% | SC 15.4 |
| 16 | KY 56,600 | NH 2.5% | NC 14.4 |
| 17 | MD 48,400 | AR 2.4% | AR 13.2 |
| 18 | AL 47,300 | AL 2.4% | MI 12.9 |
| 19 | WI 46,200 | MI 2.3% | HI 12.8 |
| 20 | UT 38,700 | HI 2.1% | AL 12.4 |
| 21 | AR 30,400 | WV 1.9% | TX 11.2 |
| 22 | PA 30,400 | TX 1.9% | MD 10.2 |
| 23 | OH 27,300 | FL 1.7% | WI 10.1 |
| 24 | CT 22,700 | MD 1.6% | DC 10.1 |
| 25 | NH 17,600 | ID 1.6% | ID 9.8 |
| US 3,026,000 | US 2.0% | US 11.9 |
Between October 2015 and October 2016, Bureau of Labor Statistics (BLS) data shows the total number of employed in California increased by 517,200 (seasonally adjusted), or 17.1% of the total net employment gains in this period for the US. Measured by percentage change in employment over the year, California rose to 10th highest. Adjusted for population, California also rose to 10th.
Nonfarm Jobs Increase 31,200
EDD reported that between September and October 2016, seasonally adjusted nonfarm wage and salary jobs grew 31,200 in October. September’s gains were revised upwards to 36,000 from the previously reported gain of 30,000 [note: this is a correction from the Friday email].
Looking at the not seasonally adjusted numbers, hiring saw increases in all but 2 industries. The change in total payroll jobs from October 2015 saw the largest increases in Health Care & Social Assistance (63,900), Professional, Scientific & Professional Services (56,000), and Government (50,400). Declines were in Manufacturing (-15,000) and Mining & Logging (-3,900).
| Not Seasonally Adjusted Payroll Jobs | Sep 2016 | Oct 2016 | Change Oct 2016 – Sep 2016 | Change Oct 2016 – Oct 2015 |
|---|---|---|---|---|
| Total Farm | 480,300 | 457,600 | -22,700 | 6,300 |
| Mining & Logging | 25,500 | 25,100 | -400 | -3,900 |
| Construction | 785,400 | 783,100 | -2,300 | 29,200 |
| Manufacturing | 1,295,700 | 1,280,800 | -14,900 | -15,000 |
| Wholesale Trade | 737,600 | 739,100 | 1,500 | 9,800 |
| Retail Trade | 1,676,500 | 1,702,800 | 26,300 | 28,800 |
| Transportation, Warehousing & Utilities | 576,200 | 574,500 | -1,700 | 7,000 |
| Information | 497,800 | 500,800 | 3,000 | 12,600 |
| Finance & Insurance | 529,900 | 531,000 | 1,100 | 3,900 |
| Real Estate & Rental & Leasing | 283,500 | 286,400 | 2,900 | 12,200 |
| Professional, Scientific & Technical Services | 1,267,600 | 1,279,900 | 12,300 | 56,300 |
| Management of Companies & Enterprises | 233,500 | 234,100 | 600 | 2,900 |
| Administrative & Support & Waste Services | 1,107,200 | 1,107,100 | -100 | 21,900 |
| Educational Services | 361,600 | 385,400 | 23,800 | 23,900 |
| Health Care & Social Assistance | 2,193,200 | 2,210,600 | 17,400 | 63,900 |
| Individual & Family Services | 596,900 | 602,700 | 5,800 | 18,200 |
| Arts, Entertainment, & Recreation | 310,500 | 305,200 | -5,300 | 15,200 |
| Accommodation & Food Service | 1,607,100 | 1,607,400 | 300 | 42,000 |
| Other Services | 552,400 | 557,800 | 5,400 | 6,500 |
| Government | 2,478,300 | 2,547,300 | 69,000 | 50,400 |
| Total Nonfarm | 16,519,500 | 16,658,400 | 138,900 | 367,600 |
| Total Wage & Salary | 16,999,800 | 17,116,000 | 116,200 | 373,900 |
By total number of new jobs, California had the highest increase in seasonally adjusted nonfarm jobs among the states from October 2015 to October 2016, at 389,500 or 16.5% of the US net increase. By percentage growth in jobs, California rose to 8th highest, and by population adjusted jobs growth, 12th highest.
| Rank | Number of Jobs | Employment Growth (%) | Population Adjusted (job growth per 1,000 civilian noninstitutional population) |
|---|---|---|---|
| 1 | CA 389,500 | WA 3.5% | DC 24.4 |
| 2 | FL 253,300 | OR 3.3% | WA 19.1 |
| 3 | TX 207,500 | FL 3.1% | UT 18.9 |
| 4 | WA 109,700 | UT 3.0% | OR 18.2 |
| 5 | NY 100,000 | SD 2.5% | SD 16.4 |
| 6 | GA 97,100 | CO 2.5% | FL 15.2 |
| 7 | MI 94,300 | TN 2.4% | CO 14.7 |
| 8 | NC 84,700 | CA 2.4% | TN 13.5 |
| 9 | MA 71,400 | NV 2.3% | MA 12.8 |
| 10 | TN 70,700 | GA 2.3% | NH 12.8 |
| 11 | VA 67,300 | MI 2.2% | HI 12.7 |
| 12 | CO 64,100 | HI 2.2% | CA 12.6 |
| 13 | OR 60,000 | ID 2.2% | NV 12.5 |
| 14 | AZ 53,000 | NH 2.1% | GA 12.3 |
| 15 | MO 50,900 | MA 2.0% | MI 11.9 |
| 16 | OH 50,500 | AZ 2.0% | ID 11.6 |
| 17 | UT 41,800 | NC 2.0% | DE 11.2 |
| 18 | SC 40,000 | SC 2.0% | NC 10.7 |
| 19 | PA 38,400 | DE 1.9% | MO 10.6 |
| 20 | MD 34,700 | MO 1.8% | SC 10.3 |
| US 2,357,000 | US 1.7% | US 9.3 |
Four Industries Below 2007 Pre-Recession Job Levels
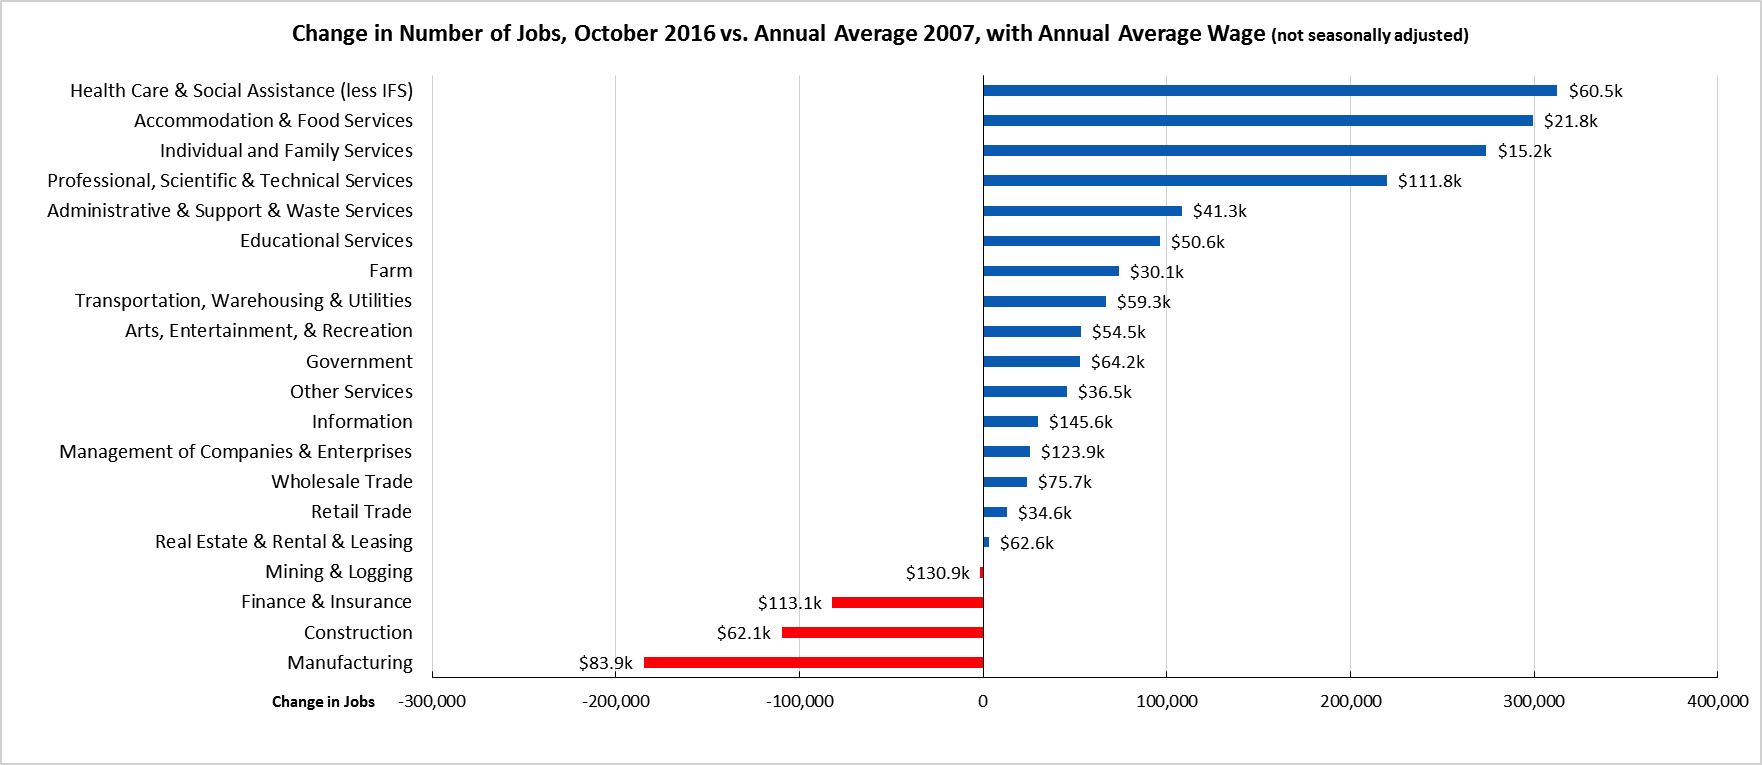
Comparing the number of jobs by industry in October 2016 (not seasonally adjusted), 4 industries had employment below the 2007 pre-recession levels. In the highest gain industries, Health Care & Social Assistance (less IFS) remained the leading industry, followed by the two lowest wage industries (Accommodation & Food Services and Individual & Family Services) and higher wage Professional, Scientific & Technical Services. Of the lagging industries, two—Manufacturing and Construction—are blue collar middle class wage industries, while the higher wage Finance & Insurance continued to lose ground.
The ability of the top 3 drivers of California’s jobs growth to continue performing in this way now faces some uncertainty as a result of changes in state and federal policy:
- An important component behind the growth in Health Care & Social Services (less IFS) has been expanded coverage under the federal Affordable Care Act, especially coverage under the state’s Medi-Cal program where enrollment grew from 7.9 million in 2012-13 to an expected 14.1 million in the current budget year. While natural growth in health care demand is expected to continue from demographic changes, a potential counterbalancing effect could be seen in jobs reliant on state and federal funding that will be affected by any changes made to the Affordable Care Act by Congress. Any changes to federal funding, however, will be softened by health care funding increases recently approved by voters in Prop. 55 and 56.
- Accommodation & Food Services contains a significant portion of the jobs that will be affected by this year’s increase to minimum wage. It remains to be seen whether these wage increases will have little effect on jobs growth, or whether the result will be an acceleration of technology to substitute for existing jobs such as the replacement of wait and counter staff with electronic ordering in some restaurants. This policy change will also be coming into effect at a time when nationally, the current deflation in food prices is already seeing some consumer substitution in reducing restaurant visits as food prepared at home has become cheaper and restaurants have become more expensive. As measured by the CPI, prices for food at home in California have dropped an estimated 2.4% in the last year, while prices for food away at home have increased an estimated 4.0%. Comparable price changes have been seen at the national level.
- Individual & Family Services is dominated by the In-Home Supportive Services (IHSS) jobs supported through state and federal funding. The cost to the state and federal budgets to continue these job levels is now programmed to increase as a result of state actions to raise the minimum wage as well as benefit levels. The availability of sufficient funds given competing budget demands, to keep and expand these job levels remains a source of uncertainty.
Two-Tier Economy Persists
Unemployment rates (all data is not seasonally adjusted) continue to vary widely across the state, ranging from 3.8% in the Bay Area to more than double at 8.8% in the Central Valley.
| Not Seasonally Adjusted | Unemployment Rate (%) October 2016 |
|---|---|
| California | 5.3 |
| Bay Area | 3.9 |
| Orange County | 4.1 |
| Los Angeles | 5.1 |
| Central Coast | 5.1 |
| Sacramento Region | 5.2 |
| San Diego/Imperial | 5.6 |
| Central Sierra | 5.6 |
| Inland Empire | 6.1 |
| Upstate California | 6.3 |
| Central Valley | 8.8 |
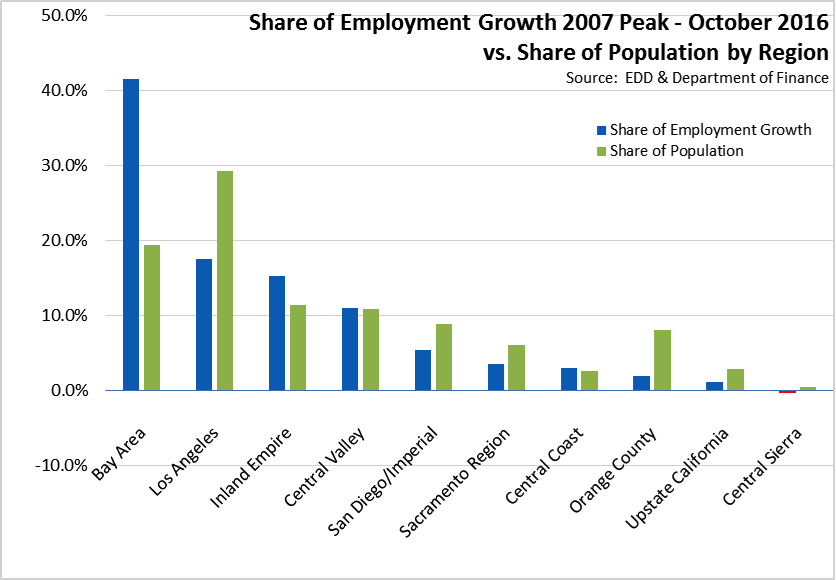
Containing just under 20% of the state’s population, the Bay Area was responsible for 41.5% of the net growth in employment since the pre-recession peak in 2007. Los Angeles Region, while now containing the second highest amount of net employment growth, has only 17.5% of net employment gains and just under 30% of the total population.
By Legislative District:
| Lowest 10 Unemployment Rates | |||||
|---|---|---|---|---|---|
| CD18 (Eshoo-D) | 3.1 | SD13 (Hill-D) | 3.0 | AD16 (Baker-R) | 2.8 |
| CD12 (Pelosi-D) | 3.2 | SD11 (Leno-D) | 3.4 | AD22 (Mullin-D) | 2.9 |
| CD45 (Walters-R) | 3.3 | SD37 (Moorlach-R) | 3.5 | AD24 (Gordon-D) | 3.1 |
| CD52 (Peters-D) | 3.4 | SD26 (Allen-D) | 3.8 | AD28 (Low-D) | 3.2 |
| CD14 (Speier-D) | 3.5 | SD39 (Block-D) | 3.8 | AD17 (Chiu-D) | 3.4 |
| CD17 (Honda-D) | 3.5 | SD36 (Bates-R) | 3.9 | AD77 (Maienschein-R) | 3.4 |
| CD33 (Lieu-D) | 3.6 | SD15 (Beall-D) | 4.0 | AD19 (Ting-D) | 3.4 |
| CD27 (Chu-D) | 3.8 | SD07 (Glazer-D) | 4.1 | AD74 (Harper-R) | 3.4 |
| CD02 (Huffman-D) | 3.9 | SD02 (McGuire-D) | 4.2 | AD73 (Brough-R) | 3.5 |
| CD48 (Rohrabacher-R) | 3.9 | SD10 (Wieckowski-D) | 4.2 | AD66 (Hadley-R) | 3.5 |
| Highest 10 Unemployment Rates | |||||
|---|---|---|---|---|---|
| CD36 (Ruiz-D) | 6.7 | SD35 (Hall-D) | 6.1 | AD80 (Gonzalez-D) | 7.2 |
| CD44 (Hahn-D) | 7.0 | SD04 (Nielsen-R) | 6.1 | AD64 (Gipson-D) | 7.3 |
| CD41 (Takano-D) | 7.1 | SD20 (Leyva-D) | 6.2 | AD34 (Grove-R) | 7.4 |
| CD09 (McNerney-D) | 7.2 | SD31 (Roth-D) | 6.3 | AD23 (Patterson-R) | 8.1 |
| CD10 (Denham-R) | 7.5 | SD05 (Galgiani-D) | 7.5 | AD13 (Eggman-D) | 8.2 |
| CD23 (McCarthy-R) | 8.0 | SD08 (Berryhill-R) | 7.6 | AD21 (Gray-D) | 9.0 |
| CD22 (Nunes-R) | 8.8 | SD12 (Cannella-R) | 7.8 | AD31 (Arambula-D) | 10.4 |
| CD16 (Costa-D) | 9.6 | SD16 (Fuller-R) | 8.0 | AD26 (Mathis-R) | 10.5 |
| CD21 (Valadao-R) | 10.6 | SD40 (Hueso-D) | 9.4 | AD32 (Salas-D) | 10.9 |
| CD51 (Vargas-D) | 11.1 | SD14 (Vidak-R) | 11.5 | AD56 (Garcia-D) | 12.9 |
Seven California MSAs in the 10 Worst Unemployment Rates Nationally
Of the 10 Metropolitan Statistical Areas (MSAs) with the worst unemployment rates nationally, 7 are in California. Of the 20 worst, 10 are in California.
| US Rank | MSA | September 2016 Unemployment Rate |
|---|---|---|
| 378 | Yuba City, CA Metropolitan Statistical Area | 7.9 |
| 379 | McAllen-Edinburg-Mission, TX Metropolitan Statistical Area | 8.0 |
| 380 | Merced, CA Metropolitan Statistical Area | 8.2 |
| 381 | Fresno, CA Metropolitan Statistical Area | 8.3 |
| 381 | Hanford-Corcoran, CA Metropolitan Statistical Area | 8.3 |
| 383 | Farmington, NM Metropolitan Statistical Area | 8.7 |
| 384 | Bakersfield, CA Metropolitan Statistical Area | 9.2 |
| 385 | Visalia-Porterville, CA Metropolitan Statistical Area | 10.2 |
| 386 | Yuma, AZ Metropolitan Statistical Area | 20.9 |
| 387 | El Centro, CA Metropolitan Statistical Area | 22.7 |
California in Full Employment?
By the technical standards applied in the 2000s, many commenters—including for the national situation, the Federal Reserve—now suggest California and the US have achieved full employment. California’s seasonally adjusted unemployment rate has been at 5.5% or below since February. The US average has been around 5.0%, while wage levels have seen some moderate growth.
But while California may be meeting the technical definition, it is at a substantially lower equilibrium level than prior to the recession. Significant and growing barriers continue to add to structural unemployment, many of which have been addressed in the Center’s reports. A significant body of workers remain detached from the labor force, both for voluntary and involuntary reasons:
- The broader unemployment measure, U-6, remains elevated above the pre-recession level. U-6 captures the unemployed as measured by the most broadly-reported monthly data plus discouraged and all other marginally attached workers plus workers having to take part time work for economic reasons. The latest data for California (as a 4-quarter running average) has U-6 at 11.7% in 2016:Q2 vs. 9.9% in 2007. The comparable rates for the US are 9.9% in 2016 vs. 8.3% in 2007. By this measure, recovery is still a ways away.
- While improving, the labor force participation rate remains low, nearly 3 percentage points below the pre-recession level and back at rates previously seen in 1976. Part of the reasons lie in the state’s changing age structure. But recent studies have also identified major declines in participation rates in specific demographic groups such as men, particularly prime working age men with a high school education or less. Fewer studies have paid attention to the even larger drops in youth participation rates. But for both groups and others, prolonged detachment from the labor force has been shown to result in lower chances for future employment, as skills become dated and as employers pass applicants over for those with a stronger employment history. For detached youth, acquiring labor force skills becomes delayed, putting them at a competitive disadvantage to those in their cohort demonstrating skills attained through part-time and other entry-level jobs or through college degrees. The current depressed participation rate is not just an indication of the extent to which full recovery remains to be attained, but it is also an indicator of the potential for extended unemployment facing key demographics in the future.
- Employment growth is heavily uneven throughout the state. The Bay Area contains counties with unemployment rates below 4%, while other parts of California continue to report unemployment rates that are among the worst in the nation. These are not pockets of unemployment, but broad swaths of the interior regions that continue to lag in wages, employment, and jobs.
- Current policies continue to increase the barriers to labor mobility that would otherwise provide a better match between workers and jobs and over time reduce the current regional disparities. As acknowledged by analyses from President Obama’s office on down, current land use and permitting policies have significantly constrained housing supply and raised housing costs, particularly in the coastal areas where job growth has been concentrated. Housing permits remain at half the level required to keep pace with population growth. Housing costs—both prices and rents—continue to rise beyond the capacity of many incomes. Recent studies have also shown California now has the worst overcrowding in the nation.
- Barriers to labor mobility also come from the state’s growing disinvestments in transportation, increasing the time and cost of worker commutes to job locations. The Center’s analysis earlier this year of commuting data showed that in spite of a growing focus for transportation funding on public transit, commuters have continued to increase their reliance on single occupant vehicles to get to work, likely in large part due to the lack of housing options closer to jobs. Updating that analysis with the latest numbers, from 1980 to 2015, the combined use of public transit, carpooling, and other modes such as walking and bicycles continued to drop from 30.3% of total commuters to 20.5%. In total numbers, the use of these three modes increased only 400,000 workers over this 35-year period while use of single occupant vehicles increased by 5.9 million. The only other major change has been the significant growth of 800,000 more workers who now work from home, but further advancements in this mode remain challenged by the increasing complexity and restrictions in the state’s employment law.
- Additional structural unemployment has stemmed from continued mismatch between jobs being grown and available skills in the labor force. The emergence of Bay Area growth centers with little history of regulation stands in contrast with low or negative growth in traditional industries subject to ever expanding oversight by the bureaucracies. At the skills extreme, the latest 2015 data shows California continues to lead all states in the share (17.8%) of persons aged 25 and over with less than a high school education. While California’s job growth now relies heavily on the lowest wage industries that can provide jobs for this population as their skills now exist, the bridge jobs that once provided avenues for upward mobility beyond that point remain in decline. As detailed in the Center’s Workforce Indicators, schools in many parts of the state still fail to foster the skills required for those industries providing the state’s higher wage job growth, in particular for Latino and Black youth.
Recent jobs reports may suggest California has reached the point of full employment, but it is at a level that leaves far too much of the state without the jobs and income needed to cope with the growing costs of living.
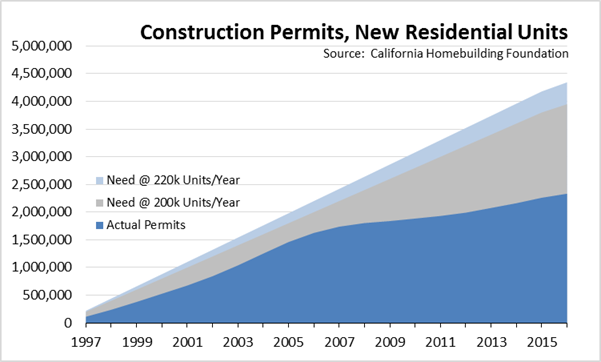
3rd Quarter Housing Permits Down 1%
The most recent data from California Homebuilding Foundation shows the number of housing units covered by new construction permits in 2016:Q3 was down 1.0% from 2015:Q3. Housing permits are on track to remain below 100,000 for the year, less than half of the level required to keep up with population growth and adding to California’s growing housing supply deficit.
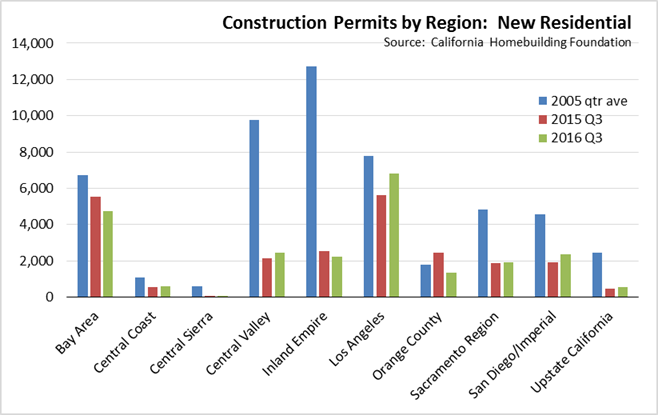
By region, housing permits were up in Los Angeles and less so in 4 other regions. All regions remained below levels seen in the last “full supply” year of 2005.
Total construction employment in 2016:Q3 averaged 766,000, an improvement from the recessionary lows but down 18% from the previous high of 933,700 construction jobs in 2006.
Data for additional geographic areas including counties and Congressional, Senate, and Assembly Districts is available in the Center’s Economic Indicators page.
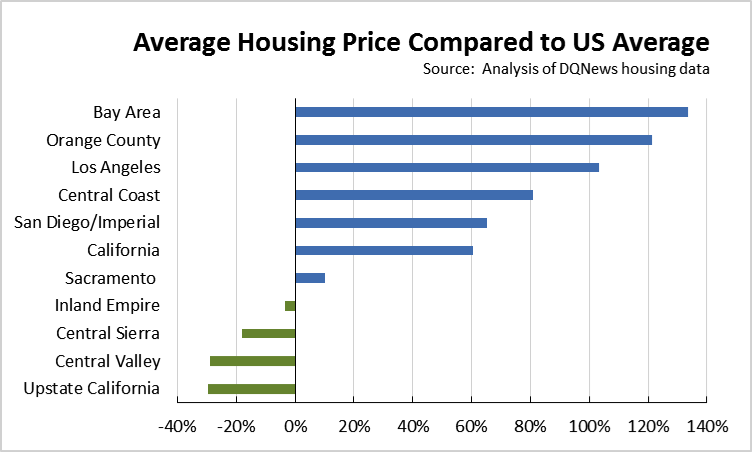
3rd Quarter Housing Prices 60.6% Above US Average
The Economic Indicators have also been updated with the 2016:Q3 housing price data. Overall, California average housing price was 60.6% above the US average. By region, the price premium ranged from 133.6% higher in the Bay Area, to 29.6% lower in Upstate California.
Data for additional geographic areas including counties and Congressional, Senate, and Assembly Districts is available in the Center’s Economic Indicators page. Data for the 2nd and 3rd quarters are subject to revision as the underlying US data is revised in the next quarter.
Note: All data sources, methodologies, and historical data series available at CenterforJobs.org.