Highlights for policy makers:
- COVID-19 and the State Economy
- CaliFormer Businesses: Update
- Nonfarm Jobs: 30,800 Below Pre-Covid Peak
- Job Change by Industry
- Employment 230,900 Below Pre-Covid Level
- Labor Force Participation Rate
- Unemployment Rates by Legislative Districts
- Unemployment Rates by Region
- Employment Recovery by Region
- MSAs with the Worst Unemployment Rates
COVID-19 and the State Economy
As discussed in our preliminary report on the October data, the state’s recovery progress continued to be mixed. Nonfarm jobs finally reached a recovery point—defined by the pre-pandemic peak in February 2020—for nonfarm jobs, but also posted the third month in a row with a contraction in the number of employed. In all, California took 32 months to reach the jobs recovery benchmark.
Other states by giving a higher priority to rapid jobs recovery reached this point far earlier. For example, Texas passed this point in November 2021; Florida did so in October 2021. In all, the most recent data shows that the number of states exceeding the pre-pandemic job numbers rose to 25, while the number of states exceeding this recovery measure for employment dipped to 26.
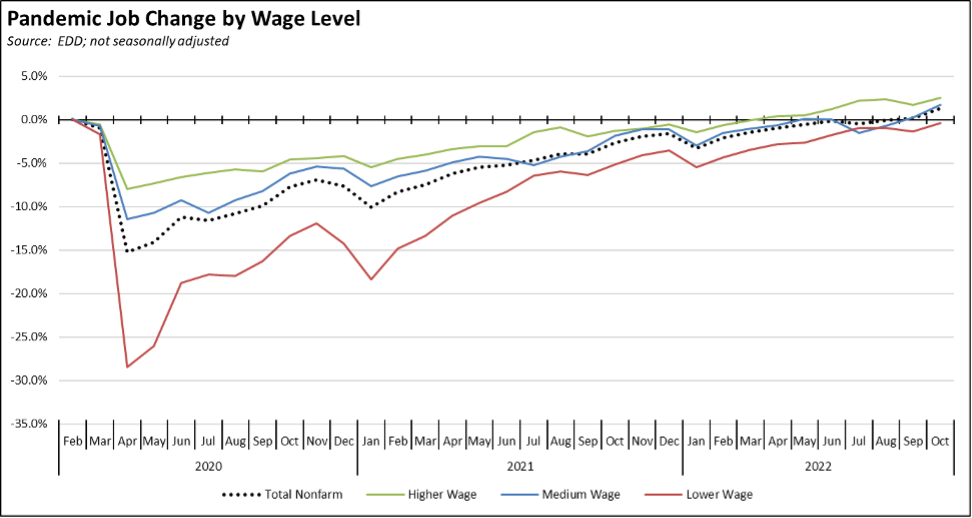
The jobs recovery in California also varies across industries and wage level. Using the unadjusted numbers to show results by average wage level, recovery and now growth continues to be the strongest in the higher wage industries. The medium wage industries continue to track overall nonfarm trends. The lower wage industries, in contrast, still have yet to reach this recovery benchmark.
Future jobs growth faces two primary prevailing forces. The risk of recession in 2023 appears to be increasing, although most forecasts expect one to be relatively mild under current Fed policies. Continued disruptions in energy markets, with California energy prices still soaring to new heights and the federal administration apparently still hoping for an energy bailout from foreign sources rather than domestic production, could affect the severity as well.
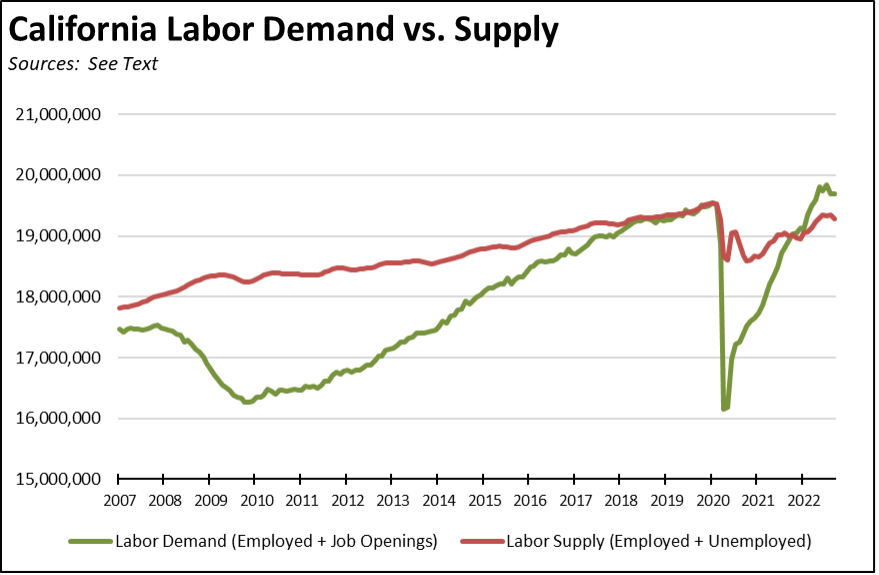
More critically, labor shortages continue to weigh on future job potential. As indicated in the latest data, the labor force remains stagnant while demand for labor as reflected in unfilled job openings has stayed at elevated levels, although the numbers for California have shown some softening as companies especially in the tech industry have cut back on hiring plans.
Borrowing a chart concept from the Atlanta Fed to illustrate this point by looking at just the raw numbers, the unemployment problem during the Great Recession was primarily demand. The severe jobs loss at the beginning of that recession saw only a slow recovery that was hindered by an increase in both regulatory and tax costs. In the pandemic recovery period, the shift has been to a supply issue as labor availability remains below the pre-pandemic levels and is now beginning to show a tapering off as well. The demand although weakening is there for further jobs growth. The supply is not, both from the resident population and a sharp decline in both domestic and foreign in-migration that previously bolstered the economy with the needed skills mixes.
CaliFormer Businesses: Update
Additional CaliFormer companies identified since our last monthly report are shown below. The listed companies include those that have announced: (1) moving their headquarters or full operations out of state, (2) moving business units out of state (generally back office operations where the employees do not have to be in a more costly California location to do their jobs), (3) California companies that expanded out of state rather than locate those facilities here, and (4) companies turning to permanent telework options, leaving it to their employees to decide where to work and live. The list is not exhaustive but is drawn from a monthly search of sources in key cities.
The companies shown below were augmented with information from the recent Why Company Headquarters Are Leaving California in Unprecedented Numbers report by Joseph Vranich and Lee E. Ohanian. In some cases, the moving dates for companies listed in that report are listed as the 2018-2021 range given in the report.
| wdt_ID | Companies | From | To | Reason | Link | Date |
|---|---|---|---|---|---|---|
| 1 | 4M Analytics | Palo Alto | Texas | HQ move | Read More | 2022 |
| 2 | Academy of Country Music | Los Angeles | Tennessee | HQ move | Read More | 2021 |
| 3 | AeroVironment, Inc. | Simi Valley | Virginia | HQ move | Read More | 2021 |
| 4 | Allspring | San Francisco | North Carolina | HQ move | Read More | 2022 |
| 5 | American Metal Bearing Co. | Garden Grove | Florida | HQ move | Read More | 2022 |
| 6 | Anomalie | San Francisco | Arizona | HQ move | Read More | 2022 |
| 7 | Bedrock Capital Partners LLC | San Francisco | Texas | HQ move | Read More | 2022 |
| 8 | Blue Box Air LLC | Los Angeles | Texas | HQ move | Read More | 2020 |
| 9 | Blue Buffalo (U-Turn) | Several CA communities | Arizona | HQ move | Read More | 2018-21 |
| 10 | Bold Patriot Brewing Co. | Norco | Tennessee | HQ move | Read More | 2020 |
| Companies | From | To | Reason | Link | Date |
Nonfarm Jobs: 30,800 Below Pre-Covid Peak
Nonfarm wage and salary jobs were up 56,700 (seasonally adjusted) in October, while the estimated gains in September were revised down to 5,300.
The October results put California nonfarm jobs 30,800 above the pre-pandemic peak, joining 24 other states with positive jobs growth since February 2020. California’s total lags 12 other states showing positive growth, ranging from Indiana at 33,900 to Florida at 467,000 and Texas at 663,800.
Job Change by Industry
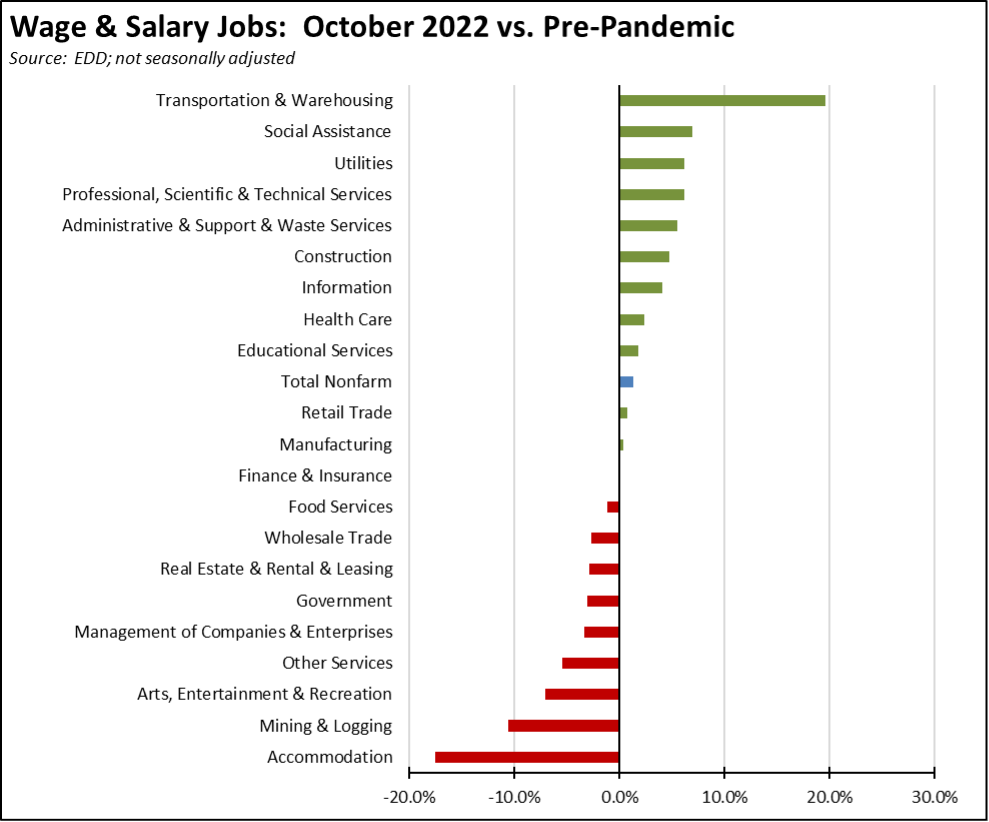
Using the unadjusted numbers that allow a more detailed look at industry shifts, the number of industries showing job levels at or exceeding the pre-pandemic February 2020 levels edged rose to 12. Transportation & Warehousing again showed the strongest cumulative jobs growth (130,700) by a large margin, with higher-wage Professional, Scientific & Technical Services remaining in second place at a gain of 83,400.
Employment 230,900 Below Pre-Covid Level
EDD reported that employment (seasonally adjusted; September preliminary) fell for the third month in a row, down 40,500 from the revised numbers for September. The number of unemployed rose 35,400.
The reported unemployment rate rose 0.2 point to 4.0%. California had the 13th highest unemployment rate among the states, and contained 13.0% of the total number of unemployed workers in the US.
In the national numbers, total US employment was down 328,000, and the number of unemployed rose by 306,000. With the labor force largely unchanged, the reported unemployment rate rose 0.2 point to 3.7%.
Figure Sources: California Employment Development Department; US Bureau of Labor Statistics
Labor Force Participation Rate
The labor force participation rate was level at 62.3%, while the US number edged down 0.1 points to 62.2%. The California rate still remains below the pre-pandemic level of 62.8%, which in turn was down substantially from prior years. Accounting for workers leaving the workforce since February 2020, there were an estimated 0.9 million out of work in October.
Unemployment Rates by Legislative Districts
We will be pausing publication of these estimates until the necessary data is available for the new legislative district boundaries from the American Community Survey.
Unemployment Rates by Region
Unemployment rates (not seasonally adjusted) compared to pre-pandemic February 2020 are shown below.
Figure Source: California Employment Development Department
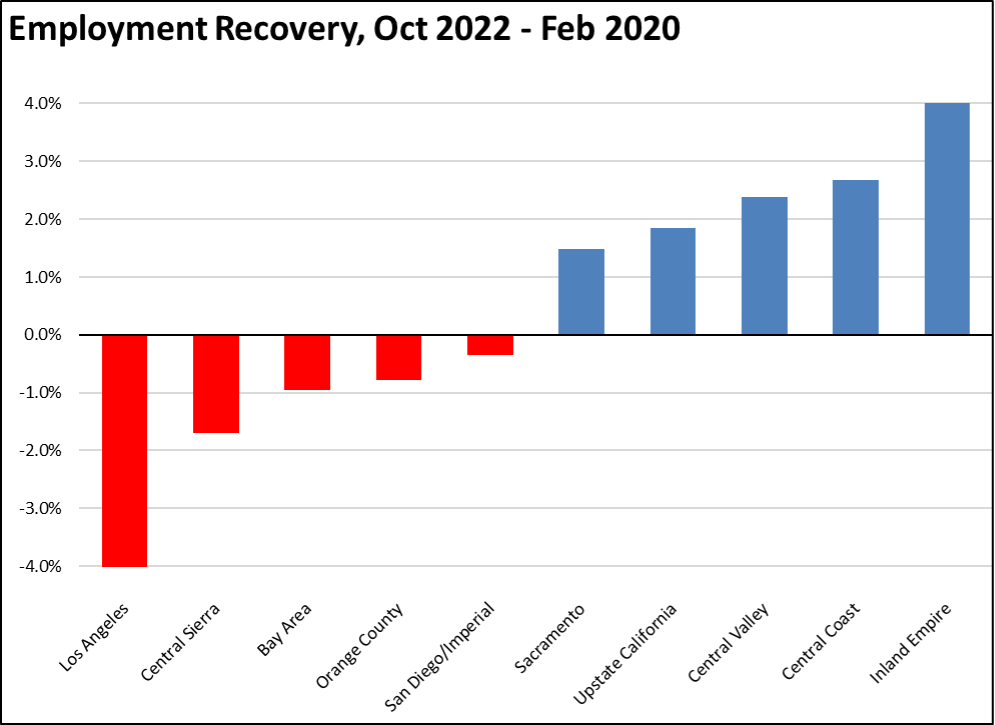
Employment Recovery by Region
Los Angeles Region continues to lag the rest of the state in recovery to the pre-pandemic peak employment levels. Central Sierra shifted into the negative column primarily due to seasonal factors.
MSAs with the Worst Unemployment Rates
The number of California MSAs among the 25 regions with the worst unemployment rates in August rose to 8. Los Angeles-Long Beach-Anaheim MSA remained out of this group, but dipped to #308 in a tie with 9 other MSAs in other states. The best performing California urban region was again San Jose-Sunnyvale-Santa Clara MSA, dropping to a tie with 7 other MSAs at #36, with an unemployment rate of 2.2% compared to the best performing region, Mankato-North Mankato, MN MSA, at 1.3%.