Highlights for policy makers:
- Unemployment Rate Declines to 5.9%; Total Employment Rises 11,900
- State Employment Growth Rankings
- Labor Force Participation Rate Declines to 62.2%–Lowest Point Since 1976
- Nonfarm Jobs Increase 8,200
- 6 Industries Remain Below 2007 Pre-Recession Job Levels
- 1 County Remains in Double-Digit Unemployment; One-Third are 5% or Less
- 7 California MSAs in Nation’s 10 Worst Unemployment Rates
- Two-Tier Economy Persists
- Bay Area Continues to Dominate Employment Growth
Unemployment Rate Declines to 5.9%; Total Employment Rises 11,900
The Labor Force data for September 2015 (seasonally adjusted; California preliminary) is shown below, along with the change from the prior month:
| Seasonally Adjusted | California | US | ||
|---|---|---|---|---|
| Sep 2015 | Change from Aug 2015 | Sep 2015 | Change from Aug 2015 | |
| Unemployment Rate | 5.9 | -0.2 | 5.1 | 0 |
| Labor Force | 19,004,200 | -0.2% | 156,715,000 | -0.2% |
| Participation Rate | 62.2 | -0.1 | 62.4 | -0.2 |
| Employment | 17,883,600 | 0.1% | 148,800,000 | -0.2% |
| Unemployment | 1,120,600 | -3.7% | 7,915,000 | -1.4% |
The related not seasonally adjusted numbers (California preliminary), with the change from September 2014;
| Not Seasonally Adjusted | California | US | ||
|---|---|---|---|---|
| Sep 2015 | Change from Sep 2014 | Sep 2015 | Change from Sep 2014 | |
| Unemployment Rate | 5.5 | -1.5 | 4.9 | -0.8 |
| Labor Force | 18,946,000 | 0.5% | 156,607,000 | 0.5% |
| Participation Rate | 62.0 | -0.4 | 62.3 | -0.5 |
| Employment | 17,911,900 | 2.2% | 148,980,000 | 1.4% |
| Unemployment | 1,034,200 | -21.8% | 7,628,000 | -14.9% |
California Employment Development Department’s (EDD) latest release shows on a seasonally adjusted basis, total employment grew by 11,900 from August, while the number of unemployed dropped by 43,400. California’s seasonally adjusted unemployment rate declined from 6.1% in August to 5.9% in September. The unadjusted rate decreased from 7.0% in September 2014 to 5.5% in September 2015.
Total US employment saw a seasonally adjusted increase of 236,000, while the number of unemployed dropped 114,000.
As on the national level, California’s improved unemployment rate stems primarily from a reduced labor force participation rate. The unadjusted numbers show a steep drop in the labor force by 125,000 from August 2015. Whether this is a statistical event or a continuation of the latest decline trend that began in February 2013, will be shown in the results from the coming months.
State Employment Growth Rankings
California’s seasonally adjusted unemployment rate was 12.2% higher than the national rate. California had the 14th highest unemployment rate among the states (including DC).
| Rank | Number of Employed | Percentage Change | Population Adjusted (employment growth per 1,000 civilian noninstitutional population) |
|---|---|---|---|
| 1 | CA 399,259 | MS 5.6% | MS 27.7 |
| 2 | NY 159,537 | ID 3.5% | ID 21.0 |
| 3 | NC 118,509 | AR 3.3% | NV 18.3 |
| 4 | TN 82,747 | NV 3.1% | RI 18.2 |
| 5 | MI 67,987 | RI 3.0% | AR 17.7 |
| 6 | IN 66,711 | SC 3.0% | OK 17.3 |
| 7 | MS 62,933 | OK 3.0% | DC 17.3 |
| 8 | MD 62,906 | TN 3.0% | SC 16.6 |
| 9 | SC 62,548 | DE 2.8% | TN 16.1 |
| 10 | WA 57,588 | NC 2.7% | DE 16.0 |
| 11 | AZ 55,256 | DC 2.7% | UT 15.5 |
| 12 | IL 51,491 | UT 2.4% | NC 15.4 |
| 13 | OK 51,151 | CA 2.3% | MD 13.4 |
| 14 | PA 50,661 | IN 2.2% | CA 13.2 |
| 15 | GA 44,128 | MD 2.1% | IN 13.1 |
| 16 | NV 40,584 | MT 2.1% | MT 12.7 |
| 17 | AR 40,584 | AZ 1.9% | AZ 10.6 |
| 18 | UT 32,736 | NY 1.8% | CT 10.6 |
| 19 | MA 32,461 | WA 1.8% | WA 10.4 |
| 20 | CT 30,292 | CT 1.7% | NY 10.1 |
| US 2,193,000 | US 1.5% | US 8.7 |
Between September 2014 and September 2015, Bureau of Labor Statistics (BLS) data shows the total number of employed in California increased by 399,259 (seasonally adjusted), or 18.2% of the total net employment gains in this period for the US. Measured by percentage change in employment over the year, California was 13th highest. Adjusted for population, California dropped one slot to 14th. While California remains above the US average in all three measures for overall employment growth, the last two measures which take into account the relative size of the states indicates that California continues to lie in the second quartile.
Labor Force Participation Rate Remains at 62.2%–Lowest Point Since 1976
California’s seasonally adjusted labor force participation rate is now at its lowest point since 1976. This latest decline trend since February 2013 has been a key factor in the improvement in the state’s unemployment rate, as persons have left the labor force and are no longer counted among the unemployed. More critically, the continuing decline in labor force participation is a structural change producing comparatively fewer income earners per household, and thereby lower total income for some households that in turn reduce housing affordability and increase the relative incidence of cost-of-living adjusted poverty. Continuing declines in the number of income earners relative to the economy further has long term implications to the stability of public revenues and demand on public services.
Nonfarm Jobs Increase 8,200
EDD reported that between August and September 2015, seasonally adjusted nonfarm payroll jobs increased by 8,200. The August job gains were revised upwards to 42,000.
Looking at the not seasonally adjusted numbers, the change in nonfarm payroll jobs from August 2015 saw the largest increases in Government (71,600) and Educational Services (18,500) as schools continued staffing up for the academic year, Administrative & Support & Waste Services (14,800), Health Care & Social Services (7,300), and Farm (6,200). Biggest declines were in Accommodation & Food Service (-10,700), Professional, Scientific & Technical Services (-10,700), and Arts, Entertainment & Recreation (-8,200). Finance and Real Estate combined also were down -7,200. The industries were essentially split, with 9 improving and 10 declining for the month.
| Not Seasonally Adjusted Payroll Jobs | Aug 2015 | Sep 2015 | Change Sep 2015 – Aug 2015 | Change Sep 2015 – Sep 2014 |
|---|---|---|---|---|
| Total Farm | 469,200 | 475,400 | 6,200 | 8,900 |
| Mining & Logging | 29,800 | 29,400 | -400 | -3,000 |
| Construction | 744,800 | 744,600 | -200 | 47,800 |
| Manufacturing | 1,289,000 | 1,288,200 | -800 | -1,300 |
| Wholesale Trade | 741,700 | 740,400 | -1,300 | 20,800 |
| Retail Trade | 1,661,500 | 1,663,600 | 2,100 | 37,200 |
| Transportation, Warehousing & Utilities | 547,000 | 548,400 | 1,400 | 17,400 |
| Information | 475,400 | 478,900 | 3,500 | 17,200 |
| Finance & Insurance | 521,800 | 517,900 | -3,900 | -700 |
| Real Estate & Rental & Leasing | 277,400 | 274,100 | -3,300 | 6,000 |
| Professional, Scientific & Technical Services | 1,275,400 | 1,264,700 | -10,700 | 76,400 |
| Management of Companies & Enterprises | 231,700 | 231,600 | -100 | 6,900 |
| Administrative & Support & Waste Services | 1,081,000 | 1,095,800 | 14,800 | 46,500 |
| Educational Services | 334,200 | 352,700 | 18,500 | 2,100 |
| Health Care & Social Assistance | 2,127,900 | 2,135,200 | 7,300 | 59,000 |
| Individual & Family Services | 580,500 | 583,600 | 3,100 | 4,200 |
| Arts, Entertainment, & Recreation | 300,300 | 292,100 | -8,200 | 14,500 |
| Accommodation & Food Service | 1,570,900 | 1,560,200 | -10,700 | 64,700 |
| Other Services | 549,400 | 549,900 | 500 | 5,000 |
| Government | 2,338,600 | 2,410,200 | 71,600 | 33,200 |
| Total Nonfarm | 16,097,800 | 16,177,900 | 80,100 | 449,700 |
| Total Wage & Salary | 16,567,000 | 16,653,300 | 86,300 | 458,600 |
By total number of new jobs, California had the highest increase in seasonally adjusted nonfarm jobs among the states from September 2014 to September 2015, at 444,300 or 16.1% of the US net increase. By percentage growth in jobs, California was the 6th highest, and by population adjusted jobs growth, 8th highest.
| Rank | Number of Jobs | Percentage Change | Population Adjusted (job growth per 1,000 civilian noninstitutional population) |
|---|---|---|---|
| 1 | CA 444,300 | UT 3.7% | UT 23.2 |
| 2 | FL 235,700 | SC 3.2% | DC 18.6 |
| 3 | TX 224,800 | WA 3.1% | WA 16.9 |
| 4 | NY 127,300 | ID 3.1% | SC 16.6 |
| 5 | NC 107,600 | FL 3.0% | ID 16.0 |
| 6 | WA 94,600 | CA 2.8% | NV 15.3 |
| 7 | GA 84,200 | NV 2.8% | OR 15.1 |
| 8 | MI 84,100 | OR 2.8% | CA 14.5 |
| 9 | MA 67,200 | NC 2.6% | FL 14.5 |
| 10 | IN 65,900 | IN 2.2% | NC 13.8 |
| US 2,752,000 | US 2.0% | US 10.9 |
6 Industries Remain Below 2007 Pre-Recession Job Levels
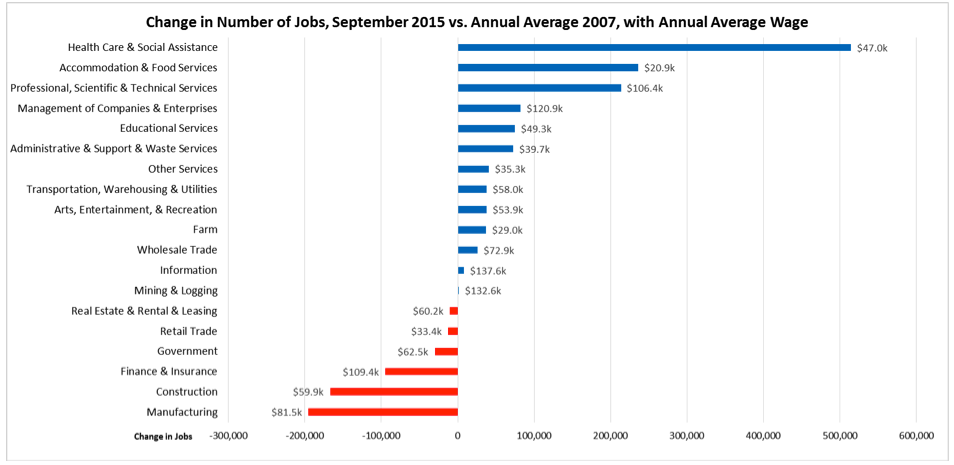
Comparing the number of jobs by industry in September 2015 (seasonally adjusted), 6 industries remain below the 2007 pre-recession levels. Note that from the not seasonally adjusted data, over half of the Health Care & Social Assistance net jobs shown in the chart are attributable to Individual & Family Services, the industry dominated by In-Home Supportive Services and paying only $14,700 average annual wages. Also note that the Government job numbers are influenced by the seasonal employment factors in education.
1 County Remains in Double-Digit Unemployment, One-third are 5% or Less

7 California MSAs in Nation’s 10 Worst Unemployment Rates
In the BLS ranking of the nation’s 387 Metropolitan Statistical Areas (MSA) by September 2015 unemployment rate, 7 California MSAs rank in the bottom 10, and 10 California MSAs were in the bottom 20.
| US Rank | MSA | Unemployment Rate, Sep 2015 |
|---|---|---|
| 377 | Vineland-Bridgeton, NJ MSA | 8.7% |
| 379 | Madera, CA MSA | 8.8% |
| 379 | Rocky Mount, NC MSA | 8.8% |
| 381 | Fresno, CA MSA | 8.9% |
| 382 | Hanford-Corcoran, CA MSA | 9.1% |
| 383 | Bakersfield, CA MSA | 9.3% |
| 384 | Merced, CA MSA | 9.7% |
| 385 | Visalia-Porterville, CA MSA | 11.0% |
| 386 | El Centro, CA MSA | 23.7% |
| 387 | Yuma, AZ MSA | 26.9% |
The highest ranked California MSA—San Jose-Sunnyvale-Santa Clara MSA—tied with 12 other MSAs nationally at rank 77 with an unemployment rate of 4.1%.
Two-Tier Economy Persists
Unemployment rates (all data is not seasonally adjusted) continue to vary widely across the state, ranging from 3.8% in the Bay Area to more than double at 8.2% in the Central Valley.
| Not Seasonally Adjusted | Unemployment Rate (%) September 2015 |
|---|---|
| California | 5.5 |
| Bay Area | 3.8 |
| Orange County | 4.0 |
| Sacramento Region | 5.1 |
| Central Coast | 5.0 |
| San Diego | 5.4 |
| Central Sierra | 5.6 |
| Los Angeles | 6.0 |
| Inland Empire | 6.1 |
| Upstate California | 6.2 |
| Central Valley | 8.2 |
Ratio of Highest to Lowest Rate: 2.16
By County:
| Lowest 3 Unemployment Rates | |
|---|---|
| San Mateo County | 3.0 |
| Marin County | 3.1 |
| San Francisco County | 3.2 |
| Highest 3 Unemployment Rates | |
|---|---|
| Colusa County | 9.2 |
| Tulare County | 9.9 |
| Imperial County | 21.6 |
Ratio of Highest to Lowest Rate: 7.20
By Legislative District:
| Lowest 10 Unemployment Rates | |||
|---|---|---|---|
| SD 13 (Hill – D) | 2.8 | AD 22 (Mullin – D) | 2.8 |
| SD 11 (Leno – D) | 3.2 | AD 16 (Baker – D) | 2.9 |
| SD 37 (Moorlach – R) | 3.4 | AD 24 (Gordon – R) | 2.9 |
| SD 39 (Block – D) | 3.8 | AD 28 (Low – D) | 3.1 |
| SD 15 (Beall – D) | 3.8 | AD 19 (Ting – D) | 3.2 |
| SD 36 (Bates – R) | 3.9 | AD 17 (Chiu – D) | 3.2 |
| SD 07 (Glazer – D) | 4.0 | AD 77 (Maienschein – R) | 3.3 |
| SD 02 (McGuire – D) | 4.1 | AD 74 (Harper – R) | 3.4 |
| SD 10 (Wieckowski – D) | 4.1 | AD 73 (Brough – R) | 3.4 |
| SD 29 (Huff – R) | 4.5 | AD 68 (Wagner – R) | 3.4 |
| Highest 10 Unemployment Rates | |||
|---|---|---|---|
| SD 18 (Hertzberg – D) | 6.9 | AD 53 (Santiago – D) | 7.4 |
| SD 30 (Mitchell – D) | 7.0 | AD 59 (Jones-Sawyer – D) | 7.4 |
| SD 33 (Lara – D) | 7.1 | AD 36 (Lackey – R) | 7.7 |
| SD 24 (de León – D) | 7.2 | AD 13 (Eggman – D) | 7.9 |
| SD 35 (Hall – D) | 7.3 | AD 21 (Gray – D) | 8.7 |
| SD 05 (Galgiani – D) | 7.3 | AD 64 (Gipson – D) | 9.0 |
| SD 12 (Cannella – R) | 7.5 | AD 31 (Perea – D) | 9.5 |
| SD 16 (Fuller – R) | 7.5 | AD 26 (Mathis – R) | 9.6 |
| SD 40 (Hueso – D) | 9.0 | AD 32 (Salas – D) | 9.8 |
| SD 14 (Vidak – R) | 10.4 | AD 56 (Garcia – D) | 12.9 |
Ratio of Highest to Lowest Rate: Senate 3.69
Ratio of Highest to Lowest Rate: Assembly 4.68
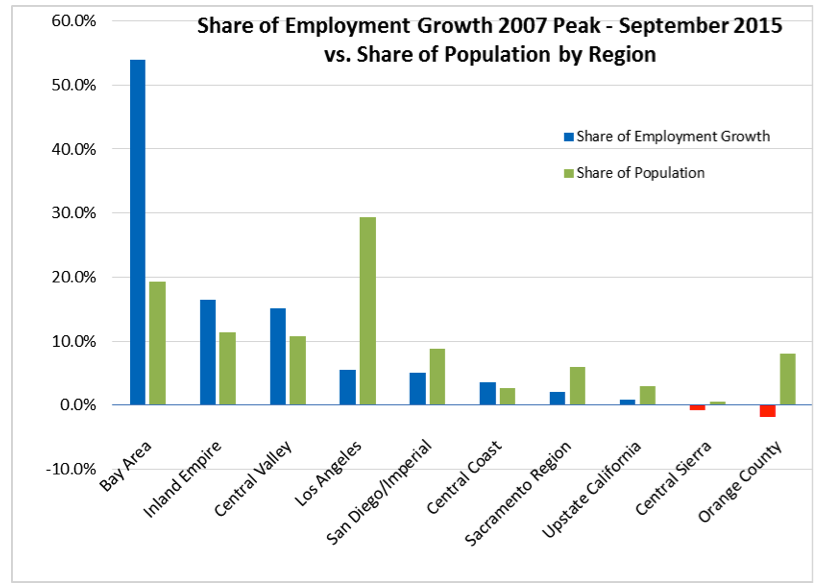
Bay Area Continues to Dominate Employment Growth
Bay Area continues to dominate employment growth in the state, capturing 53.9% of the state’s net employment growth since the 2007 pre-recession peak (November 2007), while containing only 19.4% of the state population. Due to the continued population growth, both Inland Empire and Central Valley show employment growth shares that are larger relative to their share of the population. Los Angeles Region with 29.4% of the population, contains only 5.5% of the state’s net employment growth since the pre-recession peak.
Note: All data sources, methodologies, and historical data series available at CenterforJobs.org.