Highlights for policy makers:
- Unemployment Rate Remains at 5.5%; Total Employment Up 108,600
- Labor Force Participation Rate Improves to 62.6%
- State Employment Growth Rankings
- Nonfarm Jobs Increase 30,000
- Six Industries below 2007 Pre-Recession Job Levels
- Two-Tier Economy Persists
- Seven California MSAs in the 10 Worst Unemployment Rates Nationally
- Average Wage and Compensation Growth in 2015
Unemployment Rate Remains at 5.5%; Total Employment Up 108,600
The Labor Force data for September 2016 (seasonally adjusted; California preliminary) is shown below, along with the change from the prior month:
| Seasonally Adjusted | California | US | ||
|---|---|---|---|---|
| Sep 2016 | Change from Aug 2016 | Sep 2016 | Change from Aug 2016 | |
| Unemployment Rate | 5.5 | 0 | 5.0 | 0.1 |
| Labor Force | 19,348,900 | 0.6% | 159,907,000 | 0.3% |
| Participation Rate | 62.6 | 0.4 | 62.9 | 0.1 |
| Employment | 18,278,500 | 0.6% | 151,968,000 | 0.2% |
| Unemployment | 1,070,400 | 0.9% | 7,939,000 | 1.1% |
The related not seasonally adjusted numbers (California preliminary), with the change from September 2015:
| Not Seasonally Adjusted | California | US | ||
|---|---|---|---|---|
| Sep 2016 | Change from Sep 2015 | Sep 2016 | Change from Sep 2015 | |
| Unemployment Rate | 5.3 | -0.3 | 4.9 | -0.2 |
| Labor Force | 19,437,500 | 2.7% | 158,895,000 | 1.3% |
| Participation Rate | 62.8 | 1.0 | 62.4 | 0.0 |
| Employment | 18,408,300 | 3.1% | 151,171,000 | 1.5% |
| Unemployment | 1,029,100 | -3.2% | 7,725,000 | -2.5% |
California Employment Development Department’s (EDD) latest release shows on a seasonally adjusted basis, total employment grew by 108,600 from August, while the number of unemployed grew by 9,200. California’s seasonally adjusted unemployment rate remained steady from the prior two months at 5.5%. California tied with Arizona, Illinois and Oregon for the 13th highest unemployment rate among the states. The unadjusted rate dropped from 5.6% in September 2015 to 5.3%.
Total US employment saw a seasonally adjusted increase of 354,000 from August, while the number of unemployed increased by 90,000. The national unemployment rate rose marginally to 5.0%.
Labor Force Participation Rate Improves to 62.6%
California’s participation rate (seasonally adjusted) rose 0.4 point to 62.6% in September. The comparable US rate rose marginally by 0.1 point to 62.9%. The participation rate has now shown improvement over the past three months, but has yet to rebound to levels that would constitute recovery. The overall rate still remains near the previous lows from 1976, and well below the average pre-recession level of 65.6% in 2007.
State Employment Growth Rankings
| Rank | Number of Employed | Percentage Change | Population Adjusted (employment growth per 1,000 civilian noninstitutional population) |
|---|---|---|---|
| 1 | CA 443,866 | OR 5.1% | OR 29.2 |
| 2 | TX 216,099 | TN 4.3% | TN 23.9 |
| 3 | GA 171,415 | GA 3.8% | GA 22.0 |
| 4 | FL 125,279 | IN 3.2% | IN 19.7 |
| 5 | TN 123,676 | WA 3.0% | ND 18.7 |
| 6 | WA 101,583 | AR 2.8% | WA 18.0 |
| 7 | IN 101,279 | ND 2.7% | CO 17.2 |
| 8 | NC 98,277 | CO 2.7% | NH 16.5 |
| 9 | OR 94,370 | AZ 2.7% | MA 16.1 |
| 10 | MI 93,892 | SC 2.6% | AR 15.3 |
| 11 | MA 88,587 | MA 2.6% | UT 15.1 |
| 12 | AZ 78,774 | NH 2.5% | AZ 14.9 |
| 13 | CO 73,184 | CA 2.5% | SC 14.5 |
| 14 | IL 70,432 | ME 2.4% | CA 14.5 |
| 15 | SC 55,693 | KY 2.4% | ME 14.4 |
| 16 | OH 50,389 | UT 2.3% | KY 12.9 |
| 17 | WI 46,391 | NC 2.2% | DE 12.9 |
| 18 | KY 44,325 | DE 2.2% | NC 12.6 |
| 19 | MD 42,817 | MI 2.1% | MI 11.9 |
| 20 | AL 37,111 | ID 1.9% | ID 11.4 |
| 21 | AR 35,148 | AL 1.8% | TX 10.5 |
| 22 | PA 33,677 | WV 1.8% | WI 10.2 |
| 23 | UT 32,602 | TX 1.7% | AL 9.7 |
| 24 | CT 18,082 | WI 1.6% | MD 9.1 |
| 25 | NH 17,908 | MD 1.4% | DC 9.0 |
| US 3,026,000 | US 2.0% | US 11.9 |
Between September 2015 and September 2016, Bureau of Labor Statistics (BLS) data shows the total number of employed in California increased by 443,866 (seasonally adjusted), or 14.7% of the total net employment gains in this period for the US. Measured by percentage change in employment over the year, California rose to 13th highest. Adjusted for population, California rose to 14th.
Nonfarm Jobs Increase 30,000
EDD reported that between August and September 2016, seasonally adjusted nonfarm wage and salary jobs grew 30,000 in September. August’s gains were revised downwards to 48,400 from the previously reported gain of 63,100.
Looking at the not seasonally adjusted numbers, hiring saw increases in all but 2 industries. The change in total payroll jobs from September 2015 saw the largest increases in Health Care & Social Services (65,100), Professional, Scientific & Professional Services (57,600), and Accommodation & Food Service (48,500). Declines were in Manufacturing (-18,000) and Mining & Logging (-3,300).
| Not Seasonally Adjusted Payroll Jobs | Aug 2016 | Sep 2016 | Sep 2016 – Aug 2016 | Sep 2016 – Sep 2015 |
|---|---|---|---|---|
| Total Farm | 482,300 | 480,300 | -2,000 | 8,700 |
| Mining & Logging | 25,900 | 25,500 | -400 | -3,300 |
| Construction | 785,500 | 784,400 | -1,100 | 30,300 |
| Manufacturing | 1,305,100 | 1,294,900 | -10,200 | -18,000 |
| Wholesale Trade | 739,200 | 738,100 | -1,100 | 12,100 |
| Retail Trade | 1,683,700 | 1,675,300 | -8,400 | 18,100 |
| Transportation, Warehousing & Utilities | 573,000 | 576,100 | 3,100 | 9,900 |
| Information | 501,000 | 499,800 | -1,200 | 11,100 |
| Finance & Insurance | 532,600 | 530,300 | -2,300 | 2,100 |
| Real Estate & Rental & Leasing | 284,500 | 283,000 | -1,500 | 9,300 |
| Professional, Scientific & Technical Services | 1,275,700 | 1,267,400 | -8,300 | 57,600 |
| Management of Companies & Enterprises | 234,700 | 234,400 | -300 | 4,400 |
| Administrative & Support & Waste Services | 1,091,900 | 1,105,700 | 13,800 | 31,400 |
| Educational Services | 341,600 | 361,000 | 19,400 | 21,400 |
| Health Care & Social Assistance | 2,182,300 | 2,193,500 | 11,200 | 65,100 |
| Individual & Family Services | 592,300 | 593,800 | 1,500 | 13,800 |
| Arts, Entertainment, & Recreation | 324,900 | 310,400 | -14,500 | 18,800 |
| Accommodation & Food Service | 1,607,500 | 1,608,600 | 1,100 | 48,500 |
| Other Services | 550,900 | 553,200 | 2,300 | 3,100 |
| Government | 2,395,800 | 2,471,900 | 76,100 | 40,600 |
| Total Nonfarm | 16,435,800 | 16,513,500 | 77,700 | 362,500 |
| Total Wage & Salary | 16,918,100 | 16,993,800 | 75,700 | 371,200 |
By total number of new jobs, California had the highest increase in seasonally adjusted nonfarm jobs among the states from September 2015 to September 2016, at 379,700 or 15.5% of the US net increase. By percentage growth in jobs, California was 14th highest, and by population adjusted jobs growth, 18th highest.
| Rank | Number of Jobs | Employment Growth (%) | Population Adjusted (job growth per 1,000 civilian noninstitutional population) |
|---|---|---|---|
| 1 | CA 379,700 | OR 3.5% | DC 25.8 |
| 2 | FL 276,300 | FL 3.4% | OR 18.8 |
| 3 | TX 206,800 | ID 3.2% | UT 18.1 |
| 4 | GA 118,700 | WA 3.2% | WA 17.5 |
| 5 | NY 106,600 | DE 2.9% | DE 17.0 |
| 6 | WA 100,500 | UT 2.9% | ID 16.9 |
| 7 | MI 84,900 | GA 2.8% | FL 16.6 |
| 8 | NC 82,600 | CO 2.7% | SD 16.1 |
| 9 | VA 81,100 | NV 2.7% | CO 15.9 |
| 10 | MA 78,300 | SC 2.7% | GA 15.0 |
| 11 | OH 73,400 | HI 2.5% | NV 14.9 |
| 12 | TN 71,300 | SD 2.5% | HI 14.4 |
| 13 | CO 69,200 | TN 2.5% | MA 14.1 |
| 14 | OR 61,600 | CA 2.3% | SC 14.0 |
| 15 | AZ 61,500 | AZ 2.3% | TN 13.6 |
| 16 | SC 54,400 | MA 2.2% | NH 12.7 |
| 17 | NJ 53,400 | NH 2.1% | VA 12.3 |
| 18 | PA 51,500 | VA 2.1% | CA 12.3 |
| 19 | MD 46,200 | MI 2.0% | IA 12.1 |
| 20 | MN 46,100 | VT 2.0% | VT 12.0 |
| US 2,447,000 | US 1.7% | US 9.6 |
Six Industries Below 2007 Pre-Recession Job Levels
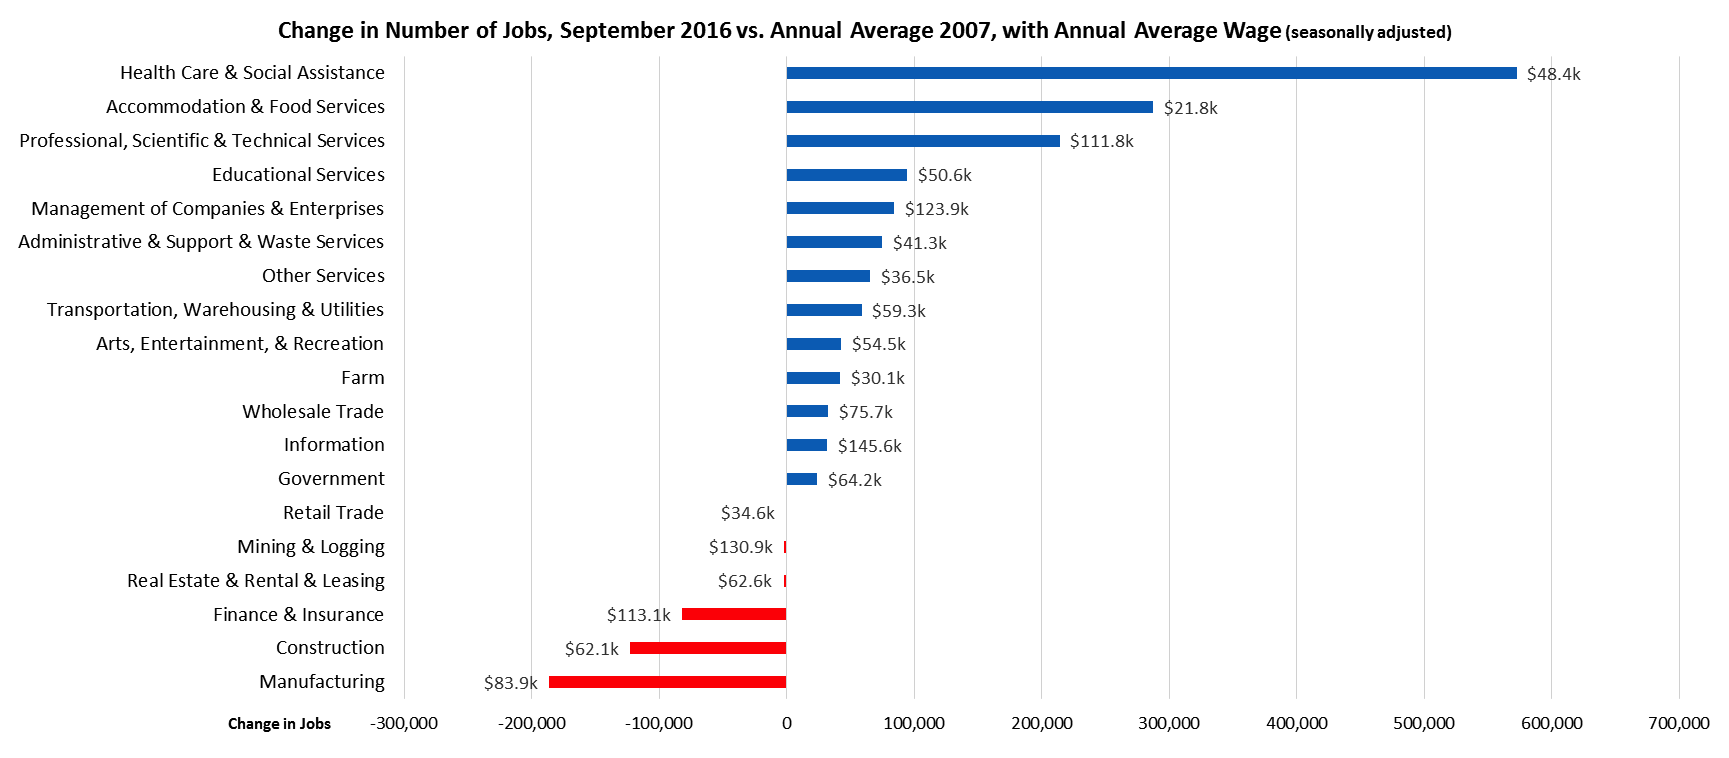
Comparing the number of jobs by industry in September 2016 (seasonally adjusted), 6 industries had employment below the 2007 pre-recession levels. In the highest gain industries, Health Care & Social Assistance remained the leading industry, followed by lowest wage Accommodation & Food Services and higher wage Professional, Scientific & Technical Services. Of the lagging industries, two—Manufacturing and Construction—are blue collar middle class wage industries, while the higher wage Finance & Insurance continued to lose ground.
Two-Tier Economy Persists
Unemployment rates (all data is not seasonally adjusted) continue to vary widely across the state, ranging from 3.9% in the Bay Area to more than double at 8.4% in the Central Valley.
| Not Seasonally Adjusted | Unemployment Rate (%) September 2016 |
|---|---|
| California | 5.3 |
| Bay Area | 3.9 |
| Orange County | 4.1 |
| Central Coast | 5.1 |
| Sacramento Region | 5.1 |
| Los Angeles | 5.2 |
| Central Sierra | 5.4 |
| San Diego/Imperial | 5.6 |
| Inland Empire | 6.2 |
| Upstate California | 6.3 |
| Central Valley | 8.4 |
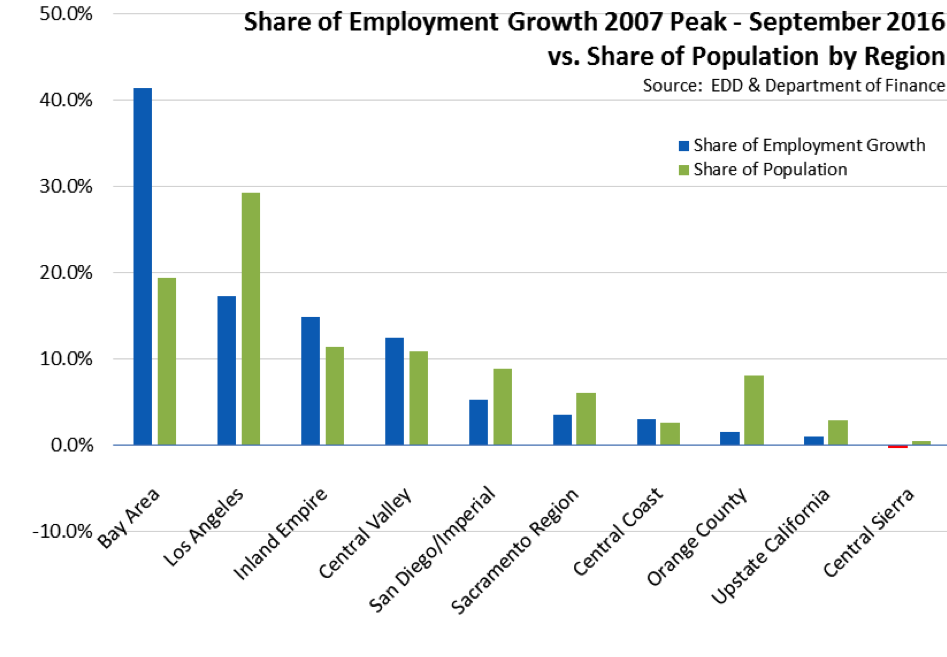
Containing just under 20% of the state’s population, the Bay Area was responsible for 41.4% of the net growth in employment since the pre-recession peak in 2007. Los Angeles Region, while now containing the second highest amount of net employment growth, has only 17.2% of net employment gains and just under 30% of the total population.
By Legislative District:
| Lowest 10 Unemployment Rates | |||||
|---|---|---|---|---|---|
| CD18 (Eshoo-D) | 3.0 | SD13 (Hill-D) | 2.9 | AD16 (Baker-R) | 2.8 |
| CD12 (Pelosi-D) | 3.1 | SD11 (Leno-D) | 3.4 | AD22 (Mullin-D) | 2.9 |
| CD45 (Walters-R) | 3.3 | SD37 (Moorlach-R) | 3.5 | AD24 (Gordon-D) | 3.0 |
| CD14 (Speier-D) | 3.4 | SD39 (Block-D) | 3.7 | AD28 (Low-D) | 3.2 |
| CD52 (Peters-D) | 3.4 | SD36 (Bates-R) | 3.8 | AD17 (Chiu-D) | 3.3 |
| CD17 (Honda-D) | 3.5 | SD26 (Allen-D) | 3.9 | AD19 (Ting-D) | 3.4 |
| CD33 (Lieu-D) | 3.7 | SD15 (Beall-D) | 4.0 | AD77 (Maienschein-R) | 3.4 |
| CD02 (Huffman-D) | 3.8 | SD07 (Glazer-D) | 4.0 | AD74 (Harper-R) | 3.4 |
| CD48 (Rohrabacher-R) | 3.9 | SD02 (McGuire-D) | 4.1 | AD73 (Brough-R) | 3.5 |
| CD27 (Chu-D) | 3.9 | SD10 (Wieckowski-D) | 4.1 | AD10 (Levine-D) | 3.5 |
| Highest 10 Unemployment Rates | |||||
|---|---|---|---|---|---|
| CD36 (Ruiz-D) | 6.9 | SD21 (Runner-R) | 6.2 | AD80 (Gonzalez-D) | 7.2 |
| CD09 (McNerney-D) | 7.1 | SD20 (Leyva-D) | 6.2 | AD23 (Patterson-R) | 7.4 |
| CD10 (Denham-R) | 7.2 | SD35 (Hall-D) | 6.2 | AD34 (Grove-R) | 7.5 |
| CD44 (Hahn-D) | 7.2 | SD31 (Roth-D) | 6.5 | AD64 (Gipson-D) | 7.5 |
| CD41 (Takano-D) | 7.2 | SD08 (Berryhill-R) | 7.0 | AD13 (Eggman-D) | 8.0 |
| CD23 (McCarthy-R) | 8.0 | SD05 (Galgiani-D) | 7.3 | AD21 (Gray-D) | 8.7 |
| CD22 (Nunes-R) | 8.2 | SD12 (Cannella-R) | 7.4 | AD31 (Arambula-D) | 9.5 |
| CD16 (Costa-D) | 8.9 | SD16 (Fuller-R) | 8.0 | AD26 (Mathis-R) | 10.0 |
| CD21 (Valadao-R) | 10.2 | SD40 (Hueso-D) | 9.5 | AD32 (Salas-D) | 10.8 |
| CD51 (Vargas-D) | 11.3 | SD14 (Vidak-R) | 11.0 | AD56 (Garcia-D) | 13.3 |
Seven California MSAs in the 10 Worst Unemployment Rates Nationally
Of the 10 Metropolitan Statistical Areas (MSAs) with the worst unemployment rates nationally, 7 are in California. Of the 20 worst, 10 are in California.
| US Rank | MSA | August 2016 Unemployment Rate |
|---|---|---|
| 378 | Madera, CA Metropolitan Statistical Area | 8.3 |
| 379 | McAllen-Edinburg-Mission, TX Metropolitan Statistical Area | 8.4 |
| 380 | Fresno, CA Metropolitan Statistical Area | 8.7 |
| 381 | Hanford-Corcoran, CA Metropolitan Statistical Area | 8.9 |
| 382 | Merced, CA Metropolitan Statistical Area | 9.3 |
| 383 | Farmington, NM Metropolitan Statistical Area | 9.4 |
| 384 | Bakersfield, CA Metropolitan Statistical Area | 9.7 |
| 385 | Visalia-Porterville, CA Metropolitan Statistical Area | 10.7 |
| 386 | El Centro, CA Metropolitan Statistical Area | 23.8 |
| 387 | Yuma, AZ Metropolitan Statistical Area | 24.6 |
Average Wage and Compensation Growth in 2015
One of the notable aspects of the current recovery has been until recently, slow or no growth in real wages and household incomes. However, the most recent data from the US Census Bureau reports that US real median household income increased 5.2% in 2015, the first annual increase in median household income since 2007 and the highest annual increase since the beginning of this data series in 1967. But even with this growth spurt, real median household income remained below its prior level in 2007, as well as its prior peak level in 1999.
In regards to wages, the most recent release from Bureau of Labor Statistics shows real average hourly earnings for private nonfarm payrolls for the US in September 2016 up 1.0% from the prior year. Compared to 2007, this measure shows real hourly wages have increased an average of only 0.7% annually.
These two data points, however, provide only one of many ways to assess the issues. While contentions over this data have been central to many recent policy debates—for example, minimum wage, associated employment law changes, income support proposals, the growing crisis over the ability of many to afford housing and other high costs of living in the state—they are not the only relevant data series for these discussions.
The selection of appropriate data is complicated by a number of factors:
- The data used matters. There are many different official measures for wages and incomes. US Bureau of Labor Statistics maintains at least 6 different data series on wages. Bureau of Economic Analysis and Census Bureau provide more. And each series is divisible into multiple sub-categories, ranging from a few to the hundreds.
- Hours matter. Average annual wage income depends not only on the hourly wage, but the number of hours worked as well. For example, real average weekly wages for private sector workers in California declined or remained level from 2007 to 2013, but grew 7.1% between 2013 and 2015 as the number of part-time workers finally began easing back closer to pre-recession levels.
- Two-tier recovery matters. As tracked in this monthly Jobs Report, the structure of the California economy has shifted substantially since the recession. Jobs growth has concentrated in higher wage industries (Health Care and Professional, Scientific & Technical Services) and in the lowest wage industries (Accommodation & Food Services and Individual & Family Services). This growth has replaced jobs loss in higher middle wage industries, primarily Manufacturing and Construction. While average or median wages have shown less movement, the range between higher and lower wage earners has increased as a result of a substantial change in the types of jobs that can compete in California.
- Tax rates matter. The steep progressivity of California’s personal income tax rates produces a more immediate impact on effective, after-tax wages than in many other states. California’s top permanent rate (9.30%) kicks in at $103,060 for married filing jointly vs. $2.1 million for New York, $1.0 million for Connecticut, and $1.0 million in DC. For lower incomes, the effective tax rate varies across the many different social services programs, all of which tie or phase out household transfer payments according to earned income levels.
- Compensation may matter more than wages. While most of the policy debates tend to showcase conclusions about wages, employers and employees have shifted more to total compensation. The level of payroll taxes affects employer resources available for wages and employee resources in after-tax earnings. Total remuneration packages have shifted over the past two decades to benefits as a result of factors including favorable tax treatment and the ability to obtain benefits such as health insurance often at a higher quality and lower cost than purchased individually.
Bureau of Economic Analysis recently released revised compensation data for 2015 that illustrates some of these factors. Under the Bureau’s definition, compensation includes wages and salaries along with benefits consisting of employer contributions for government social insurance[1] and for employee pension and insurance funds[2]. Not included are nonmonetary factors such as differences in annual leave and holidays between different companies and between the private and government sectors.
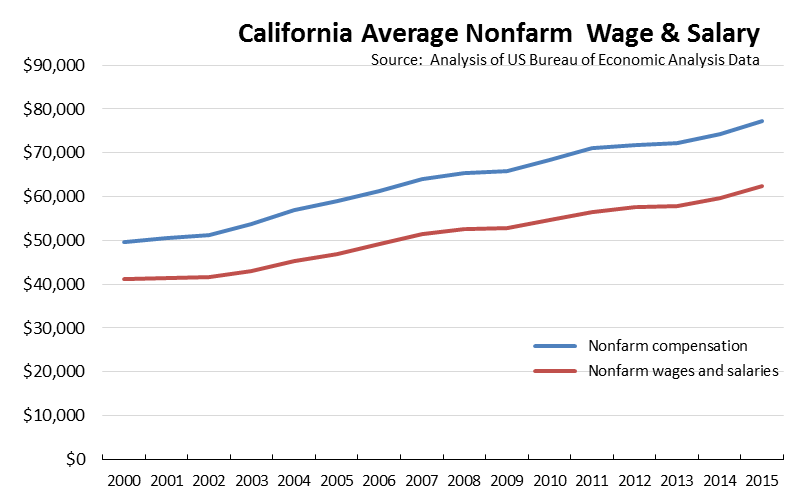
As shown in the following chart, both average wages/salaries and compensation for nonfarm wage and salary workers have grown in nominal terms since 2000, with three largely stagnation stretches during the two recessional periods. Average nonfarm compensation grew at an annual rate of 3.0%, while wages grew at 2.8%. Annual inflation as measured by the CPI was 2.2%, resulting in low but still positive real growth for both measures. Average compensation increased $27,624 during this period compared to $21,193 for wages alone.
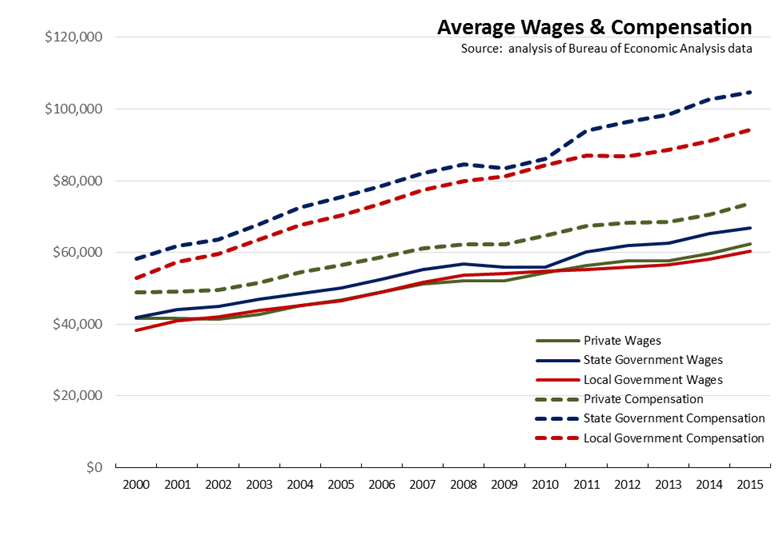
The significance of using average compensation vs. wages/salaries can be seen in the following comparison of the data for private and government workers. As shown in the following chart, average wages/salaries have tracked closely within a fairly stable band for both state and local workers. In 2000, average state wages/salaries were essentially equal to the private sector, while local government was about 8% below. In 2015, state workers were 7% above, while local government was 3% below. Looking at average compensation, the differences have been significantly wider, with the state government average going from 26% above the private sector in 2000 to 42% in 2015. While average compensation for the private sector grew somewhat faster in 2015—4.3% growth vs. 2.9% for state and local government combined—the current round of labor agreements will provide additional growth in the government averages. For example, the recently approved agreement for Unit 2 (Attorneys and Hearing Officers) provides an estimated average net compensation increase of over $34,000 over the next 4 years, or more than the total average compensation currently paid workers in Accommodation & Food Services and Social Assistance industries.
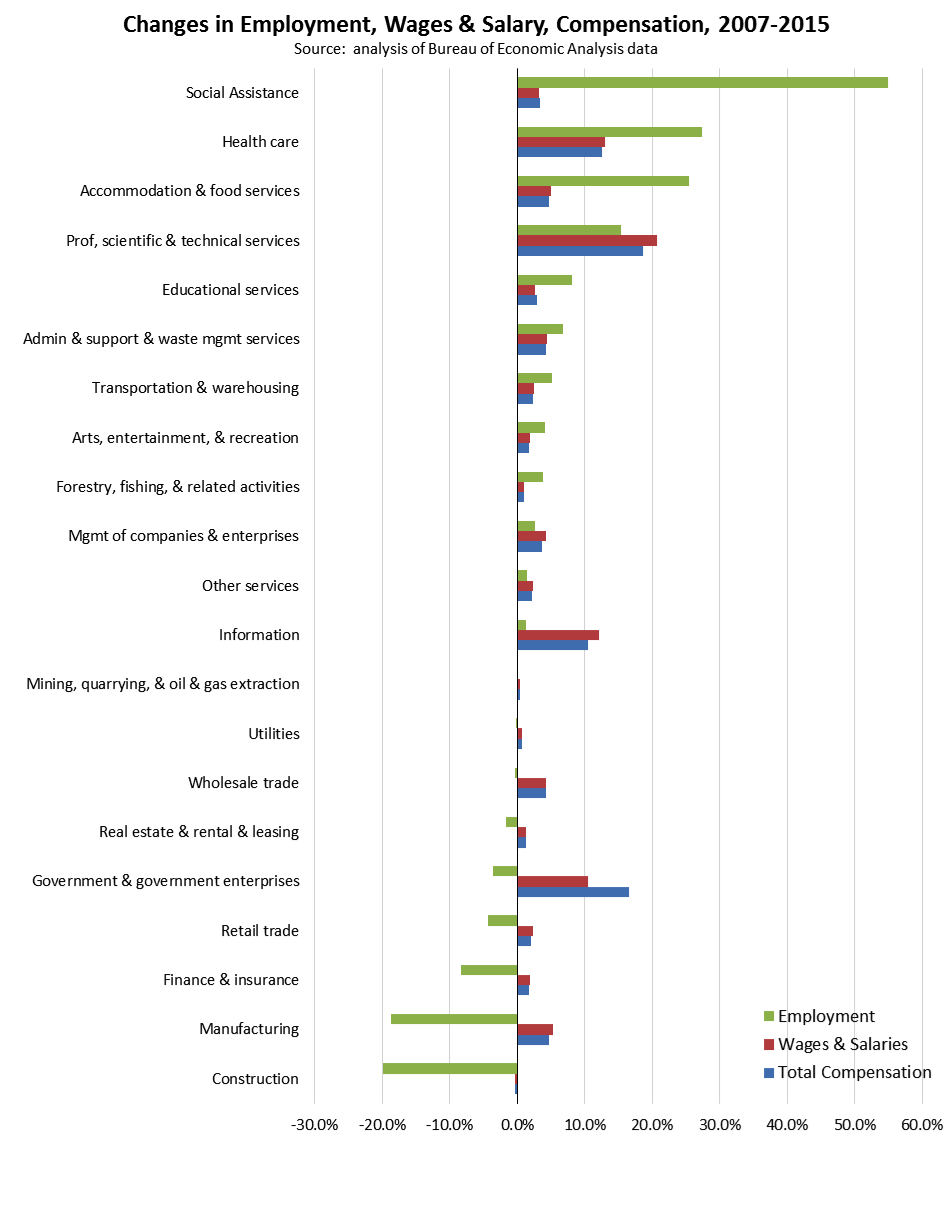
The effects of the two-tier recovery and overall income growth can be seen in the following chart. Beginning before the recession in 2007 to 2015, the Bureau’s data shows the following changes to the state’s economy:
- Employment grew by a net total of 886,000.
- Total nonfarm wages and salaries grew by $230.4 billion.
- Total nonfarm compensation grew by $282.6 billion.
These changes, however, were distributed unevenly across the economy. The following compares each industry’s share of the net employment growth to its share of the growth in both wages/salaries and compensation.
Taking some of the top growth industries:
- Social Assistance accounted for 54.9% of net jobs growth, but only 3.3% of net wage and 3.5% of net compensation growth. The continuing role of this industry along with similarly lower wage Accommodation & Food Services in being a leading source of net jobs growth is a key factor in the low growth rates the state has experienced in average wages and incomes.
- A counterbalancing factor has been wage and compensation growth at the other end of the income spectrum. Professional, Scientific & Technical Services has provided 15.4% of net jobs growth, but 20.7% of net wage and 18.7% of net compensation growth. Information, Management of Companies, and to a lesser extent Other Services have provided similar outsized wage and compensation gains compared to their jobs growth.
- Government shows a net job loss, but had the 4th largest net wage share gain and 2nd highest net compensation gain.
- Manufacturing had the second lowest net job change, equal to a loss of 18.7% of the net job change. Total wages increased by 5.3% of the total net gain and compensation by 4.8%, indicating the stronger average wage and compensation growth for those manufacturers able to continue operating in the state.
- Construction shows the worst job losses compared to 2007, but both wages and compensation have changed little since that year. As a result, average wages and compensation grew as these totals were paid to a shrinking jobs base.
[1] Old-age, survivors, and disability insurance; hospital insurance; unemployment insurance; railroad retirement; pension benefit guaranty; veterans’ life insurance; publicly administered workers’ compensation; military medical insurance; and temporary disability insurance.
[2] Including private and government pension plans and insurance funds such as for group health and life insurance; workers’ compensation; and supplemental unemployment insurance. For pension contributions, these estimates include actual employer contributions and actuarially imputed employer contributions to reflect benefits accrued by defined benefit pension plan participants through service to employers in the current period.
Note: All data sources, methodologies, and historical data series available at CenterforJobs.org.