Highlights for policy makers:
- COVID-19 and the State Economy
- CaliFormer Businesses: Update
- Nonfarm Jobs: 24,700 Below Pre-Covid Peak
- Job Change by Industry
- Employment 189,700 Below Pre-Covid Level
- Labor Force Participation Rate
- Unemployment Rates by Legislative Districts
- Unemployment Rates by Region
- Employment Recovery by Region
- MSAs with the Worst Unemployment Rates
COVID-19 and the State Economy
As discussed in our preliminary report on the September data, the state’s recovery progress continued to weaken, again falling just short of the pre-pandemic peaks in February 2020. Nonfarm job gains at 6,500 were the lowest since the loss recorded last September. Employment posted a loss for the second month in a row.
California remained 24,700 jobs (-0.1%) below the pre-pandemic peak, and 189,700 workers (-1.0%) below the prior employment peak. Nationally, nonfarm jobs continued growing to 0.3% above the pre-pandemic peak, and employment just inched above this benchmark for the first time.
The number of states exceeding the pre-pandemic job numbers grew from 19 to 23, while the number of states exceeding this recovery measure for employment remained at 28.
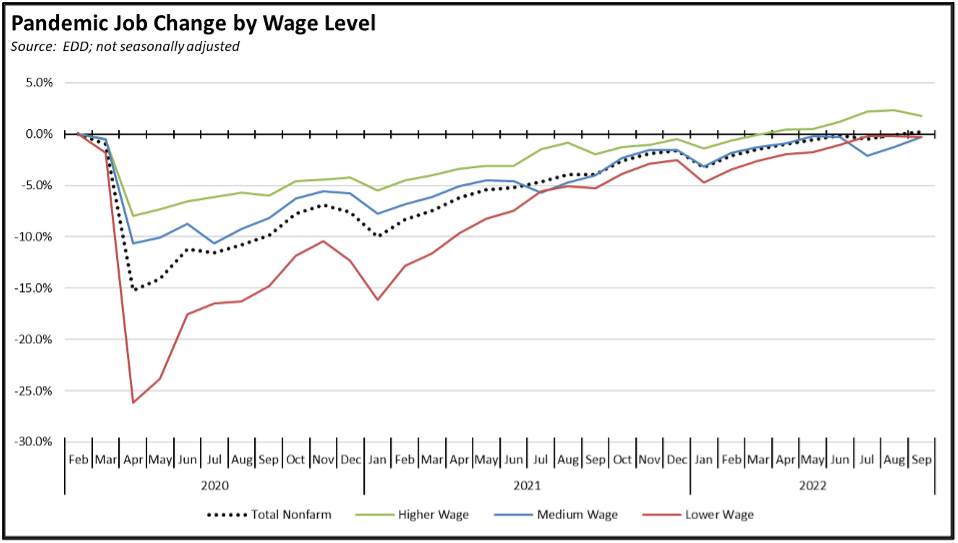
Using the unadjusted numbers to show results by average wage level, total nonfarm jobs in contrast to the seasonally adjusted numbers breached the pre-pandemic peak by 0.2%. This growth was driven by the medium wage jobs, primarily seasonal growth in Educational Services. Lower wage industries saw some retreat primarily due to Retail Trade. Higher wage jobs showed a more significant decline in part due to weakness in the high tech component.
Note that in the chart below, classification by wage has been adjusted to reflect the 2021 average wage levels.
CaliFormer Businesses: Update
Additional CaliFormer companies identified since our last monthly report are shown below. The listed companies include those that have announced: (1) moving their headquarters or full operations out of state, (2) moving business units out of state (generally back office operations where the employees do not have to be in a more costly California location to do their jobs), (3) California companies that expanded out of state rather than locate those facilities here, and (4) companies turning to permanent telework options, leaving it to their employees to decide where to work and live.
CaliFormers—the list is not only not exhaustive but also missing from a monthly search of sources in key cities.
| wdt_ID | Companies | From | To | Reason | Link | Date |
|---|---|---|---|---|---|---|
| 1 | Micron | Various | New York | $100 billion semiconductor campus | Read More | 2022 |
| 2 | Virta Health | San Francisco | Denver | HQ move | Read More | 2022 |
| 3 | Integrated Defense Products | Oxnard | Dallas | HQ move | Read More | 2022 |
| 4 | Obagi Cosmeceuticals | Long Beach | Houston | HQ move | Read More | 2022 |
| 5 | Runa Capital | Palo Alto | Switerland | HQ move | Read More | 2022 |
| 6 | Confer Inc. | San Francisco | Texas | HQ move | Read More | 2022 |
| 7 | Hitachi Vantara | Santa Clara | Texas | Cloud application center | Read More | 2022 |
| 8 | Seaspine | Carlsbad | Kentucky | Merger | Read More | 2022 |
| 9 | Trimble Inc. | Sunnyvale | Colorado | HQ move | Read More | 2022 |
| 10 | Atom Computing | Berkeley | Colorado | Quantum computing center | Read More | 2022 |
| 11 | NN Inc. | Irvine | various | Close Irvine manufacturing facility | Read More | 2022 |
| 12 | Encoded Therapeutics | South San Francisco | North Carolina | Manufacturing expansion | Read More | 2022 |
| 13 | OneD Battery Sciences | Palo Alto | Washington | Manufacturing expansion | Read More | 2022 |
| Companies | From | To | Reason | Link | Date |
Nonfarm Jobs: 24,700 Below Pre-Covid Peak
Nonfarm wage and salary jobs were up 6,500 (seasonally adjusted) in September, while the estimated gains in August were revised up to 36,000. With slowing gains, nonfarm jobs again just fell shy of the pre-pandemic peak by 24,700 (-0.1%).
Among the states, California’s job results dropped to 14th highest, with the leading performance in job gains by Florida (48,800), Texas (40,000), and North Carolina (17,400). On a running quarterly basis, California (133,900) remained in second place, behind Florida (142,200) but still ahead of Texas (131,500). California gains still are from jobs recovery, while the other two states show jobs growth having surpassed their prior peaks—Florida last October and Texas in November—much earlier.
Job Change by Industry
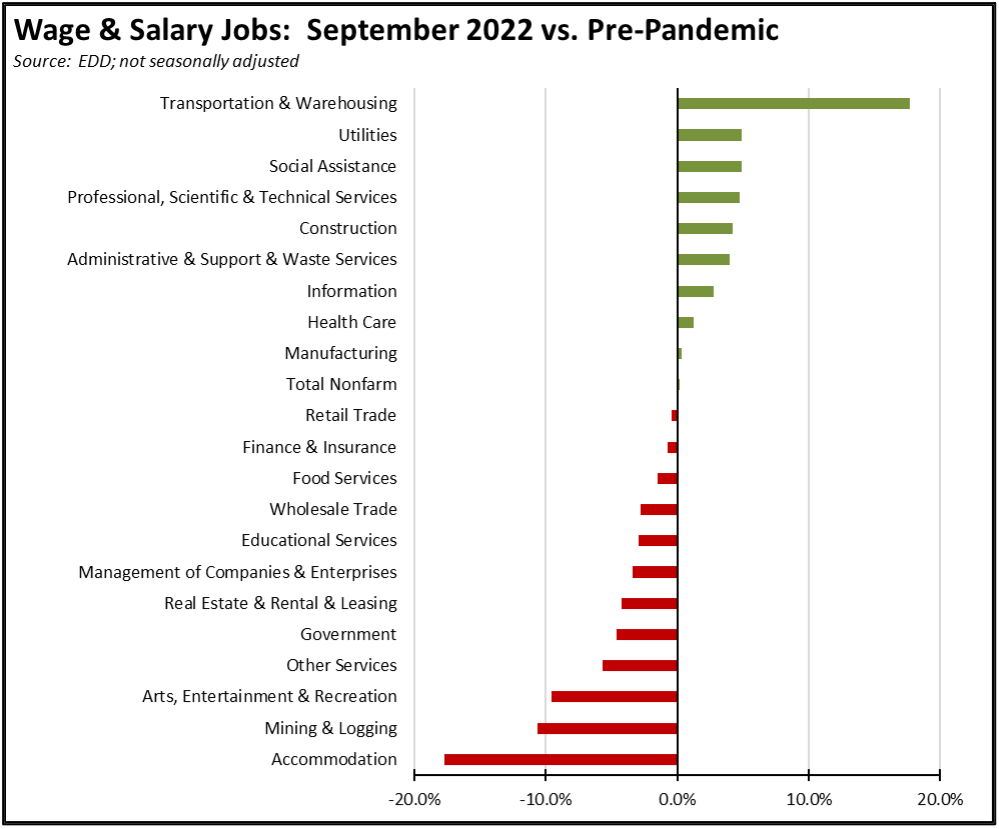
Using the unadjusted numbers that allow a more detailed look at industry shifts, the number of industries showing job levels at or exceeding the pre-pandemic February 2020 levels edged down to 9. Transportation & Warehousing again showed the strongest cumulative jobs growth (117,900) by a large margin, with higher-wage Professional, Scientific & Technical Services remaining in second place but dropping to a gain of 65,800.
Employment 189,700 Below Pre-Covid Level
EDD reported that employment (seasonally adjusted; September preliminary) fell for the second month in a row, down 20,100 from the revised numbers for August. The number of unemployed rose 37,600.
The reported unemployment rate dropped 0.2 point to 3.9%, the lowest in the current data series. Rather than representing an improvement in labor conditions, however, change in the rate was primarily the result of a drop in the total labor force. California had the 15th highest unemployment rate among the states, and contained 13.0% of the total number of unemployed workers in the US.
In the national numbers, total US employment was up 204,000, and the number of unemployed dropped by 261,000. With the labor force largely unchanged, the reported unemployment rate dropped 0.2 point to 3.5%, matching the rate recorded in February 2020.
Figure Sources: California Employment Development Department; US Bureau of Labor Statistics
Labor Force Participation Rate
The labor force participation rate retreated from its recent improvement dropping 0.2 point to 62.3%, matching the US number. The California rate still remains below the pre-pandemic level of 62.8%, which in turn was down substantially from prior years. Accounting for workers leaving the workforce since February 2020, there were an estimated 0.9 million out of work in September.
Unemployment Rates by Legislative Districts
The highest and lowest estimated unemployment rates in July are shown below. The estimates are for the current, 2012 vintage districts. Estimates for the new districts under the 2022 redistricting will be released after the required factors from the American Community Survey become available at the end of 2023.
Lowest
Highest
Unemployment Rates by Region
Unemployment rates (not seasonally adjusted) compared to pre-pandemic February 2020 are shown below.
Figure Source: California Employment Development Department
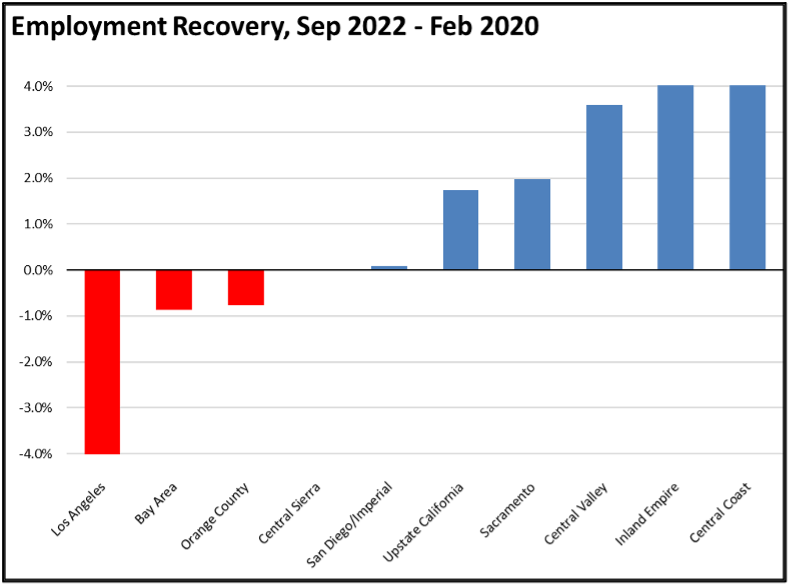
Employment Recovery by Region
Los Angeles Region continues to lag the rest of the state in recovery to the pre-pandemic peak employment levels, with all but 2 other regions moving into the recovery category.
MSAs with the Worst Unemployment Rates
The number of California MSAs among the 25 regions with the worst unemployment rates in August notched down to 6. Los Angeles-Long Beach-Anaheim MSA remained out of this group, but edged up to #298 in a tie with 15 other MSAs in other states. The best performing California urban region was again San Jose-Sunnyvale-Santa Clara MSA, edging down to a tie at #24 with 4 other MSAs, with an unemployment rate of 2.5% compared to the 3 best performing regions tied at 1.7%.