March 2016
The current Special Session for transportation funding called by Governor Brown provides a clear focus on the economic importance of California’s roads and other transportation systems. This infrastructure network serves critical roles underlying jobs growth in the state: commuting by workers to jobs, trade and goods movement, tourism, agriculture, education and transportation access for a variety of other purposes including shopping, recreation and entertainment, and trips for other daily activities.
In seeking to accommodate these economic purposes, state transportation policy has gone through various cycles, alternating between a focus on capacity expansion and a focus on higher utilization of existing systems that often has been combined with a push towards alternatives including public transit, bicycles, and other modes. In its current incarnation, state policy has shifted to a sole funding focus on the state’s rapidly deteriorating roads, largely foregoing capacity expansion other than consideration of technological solutions such as driverless vehicles. The state’s climate change policies, especially the provisions under the SB 375 land use policies and the proposed OPR revised CEQA guidelines, are likely to continue this emphasis as vehicle-related emissions are targeted through a number of actions.
The recent release of the 2014 American Community Survey data provides an opportunity to gauge how California commuters have responded to this shifting policy. The data clearly reflects that even with the well-documented and rapidly rising costs[1] of the state’s traffic congestion and costs associated with the deteriorating condition of the state’s roads, California workers continue to rely on single occupant vehicles for the primary mode of commuting. Moreover, their reliance on this mode of travel continues to grow both in absolute and relative terms.
The table below shows the estimates for the different modes of commuting used by workers (age 16 and over) since 1980. Data is drawn from the decennial census (1980-2000) and the 1-year estimates from the American Community Survey (2005-2014). During this time, California’s population has grown from 23.8 million to 38.7 million and overall jobs have grown from 10.1 million to 15.8 million.
Means of Transportation to Work by Number of Workers, California (millions)
| Workers | Drove Alone | Carpool | Public Transit | Other | Work at Home | |
|---|---|---|---|---|---|---|
| 1980 | 10.59 | 7.18 | 1.79 | 0.61 | 0.81 | 0.20 |
| 1990 | 13.94 | 9.98 | 2.04 | 0.68 | 0.79 | 0.45 |
| 2000 | 14.53 | 10.43 | 2.11 | 0.73 | 0.70 | 0.56 |
| 2005 | 15.55 | 11.51 | 1.94 | 0.73 | 0.70 | 0.67 |
| 2006 | 16.34 | 11.93 | 2.03 | 0.82 | 0.78 | 0.78 |
| 2007 | 16.42 | 12.02 | 1.95 | 0.84 | 0.84 | 0.79 |
| 2008 | 16.81 | 12.22 | 2.00 | 0.89 | 0.89 | 0.81 |
| 2009 | 16.15 | 11.79 | 1.87 | 0.84 | 0.82 | 0.84 |
| 2010 | 15.92 | 11.65 | 1.83 | 0.83 | 0.80 | 0.83 |
| 2011 | 16.05 | 11.76 | 1.78 | 0.83 | 0.83 | 0.85 |
| 2012 | 16.43 | 12.06 | 1.82 | 0.85 | 0.84 | 0.87 |
| 2013 | 16.75 | 12.26 | 1.83 | 0.89 | 0.89 | 0.87 |
| 2014 | 17.25 | 12.68 | 1.81 | 0.91 | 0.91 | 0.93 |
A number of important observations from this data:
- The number of workers relying on single occupant vehicles has grown throughout this period. The only exceptions are 2008 and 2009 as the number of workers declined during the recession.
- The number of workers using carpools in 2014 is essentially the same as those choosing this mode in 1980. Furthermore, this number has not varied widely throughout the entire period shown.
- The total number of workers using public transit (bus, streetcar, trolley, subway, railroad, or ferryboat) for commuting purposes has nearly doubled since 1980, but has yet to break the 1 million level.
- The substantial investments in public transit, bike lanes, and other alternative modes have not produced major gains in commuter use. Instead, these investments appear to have simply shifted the choices made by commuters who already are committed to getting to work through modes other than single occupant vehicles. From 1980 to 2000, public transit use grew by 116,000 while “other” modes dropped by the same amount. From 1980 to 2005, public transit use grew by 121,000 while “other” modes dropped by 113,000. In the following years, 1/3 of the growth in public transit and “other” modes was offset by reductions in carpool use.
- The most significant growth throughout this period is the number of workers choosing to work at home, which beginning in 2009 now exceeds the number of workers commuting by public transit.
Attendant with the increased reliance on single occupant vehicles, workers are also spending more time commuting. The number of workers commuting longer than 30 minutes grew from 3.2 million (30.5% of commuters) in 1980 to 6.5 million (40.6%) in 2013 and to 6.8 million (41.4%) in 2014. This trend stems in large part from the growing congestion on California roads, but also reflects the continuing influence of housing costs on the commuting choices California workers are able to make. As the state’s regulatory systems continue to drive up housing costs especially within the coastal urban areas, workers also continue to rely heavily on single occupant vehicles to expand their housing affordability options, even in face of the additional time and travel costs associated with these longer commutes.
Note that the data in the table above comes from surveys and survey methods that have changed over time, and as such are not necessarily strictly comparable on a time series basis. The relative distribution within each year across the commuting modes, however, is for many purposes a more valid basis for comparison. As shown in the following table—which contains the percentage distribution across the commuting modes for each year—this approach still shows the same general conclusions. Reliance on single occupant vehicles has grown; public transit has maintained a relatively stable but low share; and carpooling and other modes have declined in relative importance. Working at home has gone from the least used option in 1980 and moved ahead of both public transit and “other” modes in 2014.
Means of Transportation to Work by Share of Workers, California (%)
| Workers | Drove Alone | Carpool | Public Transit | Other | Work at Home | |
|---|---|---|---|---|---|---|
| 1980 | 100.0 | 67.8 | 16.9 | 5.8 | 7.7 | 1.9 |
| 1990 | 100.0 | 71.6 | 14.6 | 4.9 | 5.7 | 3.2 |
| 2000 | 100.0 | 71.8 | 14.5 | 5.0 | 4.8 | 3.8 |
| 2005 | 100.0 | 74.0 | 12.5 | 4.7 | 4.5 | 4.3 |
| 2006 | 100.0 | 73.0 | 12.4 | 5.0 | 4.8 | 4.8 |
| 2007 | 100.0 | 73.2 | 11.9 | 5.1 | 5.1 | 4.8 |
| 2008 | 100.0 | 72.7 | 11.9 | 5.3 | 5.3 | 4.8 |
| 2009 | 100.0 | 73.0 | 11.6 | 5.2 | 5.1 | 5.2 |
| 2010 | 100.0 | 73.2 | 11.5 | 5.2 | 5.0 | 5.2 |
| 2011 | 100.0 | 73.3 | 11.1 | 5.2 | 5.2 | 5.3 |
| 2012 | 100.0 | 73.4 | 11.1 | 5.2 | 5.1 | 5.3 |
| 2013 | 100.0 | 73.2 | 10.9 | 5.3 | 5.3 | 5.2 |
| 2014 | 100.0 | 73.5 | 10.5 | 5.3 | 5.3 | 5.4 |
Breaking the data down produces similar results on the regional level as well. The regional data used in this analysis draws from the same sources as for the state: decennial census county data for 1980-2000 and the American Community Survey county data for 2005-2014. However, while the state data is able to use the 1-year estimates for 2005-2014, the county data instead relies on the 5-year estimates in order to provide full coverage. For legibility, not all regions are shown on the charts; data for Central Coast, Central Sierra, and Upstate California are available in the Center’s Economic Indicators.
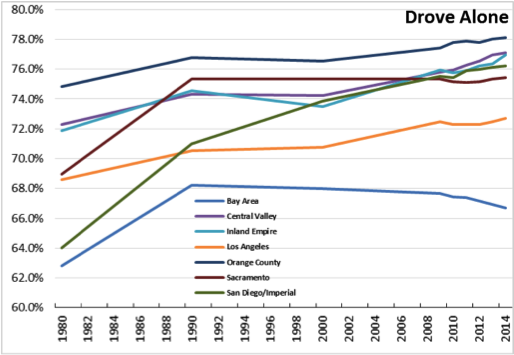
The trend towards greater single occupant vehicle use (measured by percent of commuters) shows increases across all regions except Bay Area and Central Sierra. Bay Area shows a net increase from 1980, but due to its greater public transit assets, shows a slight decline in the share of commuters driving alone beginning in 2000. Central Sierra shows a similar general pattern as commuters have shown slight shifts to other commuting modes. Highest reliance on driving alone is in Orange County, Inland Empire, and San Diego/Imperial along with some of the more rural regions in the state.
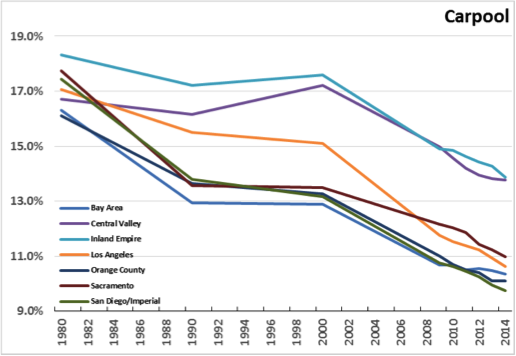
All regions show a declining share of commuting by carpool, with only Central Sierra region showing a slight uptick in the 2014 data. Carpooling remains highest in Inland Empire and the Central Valley, with the lowest rates in San Diego/Imperial, Orange County, and Bay Area regions.
Most regions have seen level or slightly declining relative use of public transit since 1990. The primary exception is the Bay Area which continues to experience an increasing reliance by workers on this commuting mode. Public Transit use remains strongest in Bay Area and Los Angeles regions, with the remaining regions grouped around a lower tier of use.
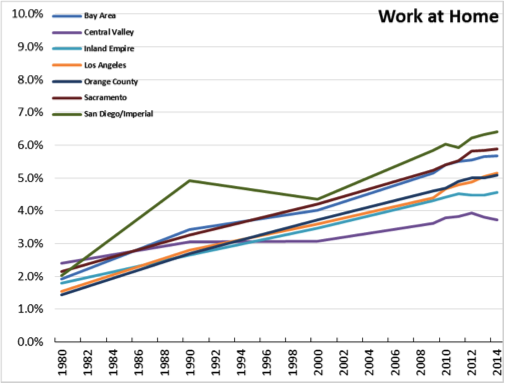
Aside from some variations in the most recent data, working at home continues to increase in all regions. Use of this commuting mode remains highest in many of the rural counties (Central Sierra, Upstate California, Central Coast), along with San Diego/Imperial and Sacramento regions. Lowest use is in the Central Valley.
Some general conclusions from this data:
- While policy efforts to shift commuting behavior from single occupant vehicles appear to have had some effect in the Bay Area through greater use in recent years of public transit and “other” modes (walking, bicycle, taxi, motorcycle, and other), the trend for other regions and the state as a whole has been a greater reliance on driving alone. And even in the Bay Area, growth of public transit and the “other modes” has come largely from the shrinking relative use of carpooling.
- Rather than shifting commuting behavior, the current conditions of the state’s roads continue to decrease effective incomes—through higher direct commuting costs along with increased vehicle wear and damage due to the deteriorating condition of the roads—for the 74% of workers that remain dependent of the traditional road systems in the state.
- Common solutions to reduce the use of vehicles—public transit, carpooling, other means such as bicycles—have not reduced the growth of driving alone for the state as a whole in spite of state and local policies and investments to encourage these alternative commute modes. Combined, public transit, carpooling, and “other” modes dropped from 30.3% of total commuters in 1980 to 21.5% in 2013 and to 21.1% in 2014. In total numbers, use of these three modes increased only 430,000 workers by 2014, while use of single occupant vehicles increased by 5.5 million workers.
- The continued growth of single occupant vehicles is fully consistent with the all-too familiar need in California to broaden the geographic search region in order to find housing commensurate with workers’ incomes. As noted in recent studies by the Legislative Analyst[2], Harvard University researchers[3], President Obama’s Chair of the Council of Economic Advisors[4], and others, the rising incidence of housing regulations—particularly within higher income and coastal areas—has forced many workers further inland in their search for housing that is affordable within their incomes. In California, the growing body of land use, energy, CEQA, and other regulations affecting housing cost and supply has put both the cost of housing ownership and rents within traditional employment centers out of the reach of many households. The current de facto policy of trying to reduce commuting by increasing congestion and its associated costs to commuters has to date not shown itself to be successful. Solutions that are far more likely to prove successful include efforts to tackle the true underlying driver of the state’s expanding commutes and increasing use of single occupant vehicles—high housing costs—through serious regulatory reform to make housing in the urban centers more affordable for a broader swath of California’s workers.
- Working at home continues to be the fastest growing alternative commuting mode, although at less than a million workers out of a total of 17 million statewide, its potential as a broader solution remains unfulfilled. However, the ability of employers to expand this option and provide the flexibility many workers desire remains challenged by the ever-growing body of California-only employment regulations and their associated litigation risks. Further expansion of this commuting mode will likely remain tied more to the self-employed and higher-income professionals rather than applying to a broader range of workers and income levels.
To provide future updates on this data, the Center’s Economic Indicators have been revised to include the commuting mode under Travel Time to Work in the Quality of Life Indicators. These data are provided for the state, regions, counties, and the Senate, and Assembly districts.
[1] See for example: Texas A&M Transportation Institute, 2015 Urban Mobility Scorecard and American Highway Users Alliance, Unclogging America’s Arteries 2015.
[2] Legislative Analyst’s Office, California’s High Housing Costs: Causes and Consequences, March 2015; Perspectives on Helping Low-Income Californians Afford Housing, February 2016.
[3] Peter Ganong and Daniel Shoag, Why Has Regional Income Convergence in the US Declined?, January 2015.
[4] Jason Furman, Barriers to Shared Growth: The Case of Land Use Regulation and Economic Rents, November 2015.