In their release of the 2016 Greenhouse Gas Emissions Inventory, California Air Resources Board (CARB)[1] points to early attainment of the 2020 reduction goal as an unqualified demonstration of the success of the state’s current climate change policies. A closer look at the numbers, however, indicates they are more the result of external factors. Furthermore, these reductions are being achieved at far greater costs to California consumers and households than similar results shown elsewhere in the country.
Emission Reductions Dependent on Three Sectors
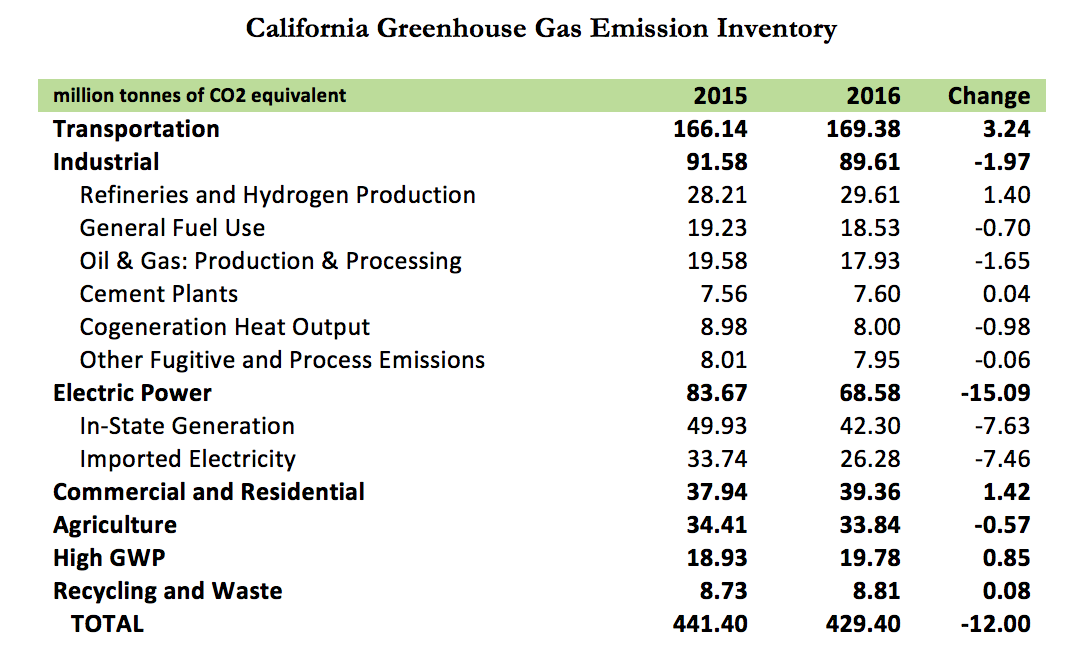
Emission levels reported in the 2016 Inventory are summarized in the table above, showing the change between 2015 and 2016. Several sectors show an increase or only minor change, although many of the regulatory mandates the state has put in place since 2010 likely have slowed these results. The primary reductions instead are reliant on three sectors: In-State Electricity Generation, Imported Electricity, and Oil & Gas: Production & Processing.
It’s the Weather
The emission reductions shown in 2016 are fully dependent on the 15.09 MMTCO2e drop associated with the Electric Power sector. However, this outcome is less the result of the state’s regulatory programs, and more due to weather—it snowed and rained more in 2016, allowing significantly higher generation of electricity from hydropower rather than combustion technologies. CARB’s more detailed Trends report[2] acknowledges this fact, but the associated press release[3] obfuscates this situation by instead claiming up front that regulations were owed the credit:
Electricity generation had the largest decline among the sectors. Emissions from this sector declined 18 percent in 2016, reflecting continued growth in renewable energy – such as solar, wind and geothermal – as a result of the state’s Renewables Portfolio Standard, and a corresponding drop in natural gas generation.
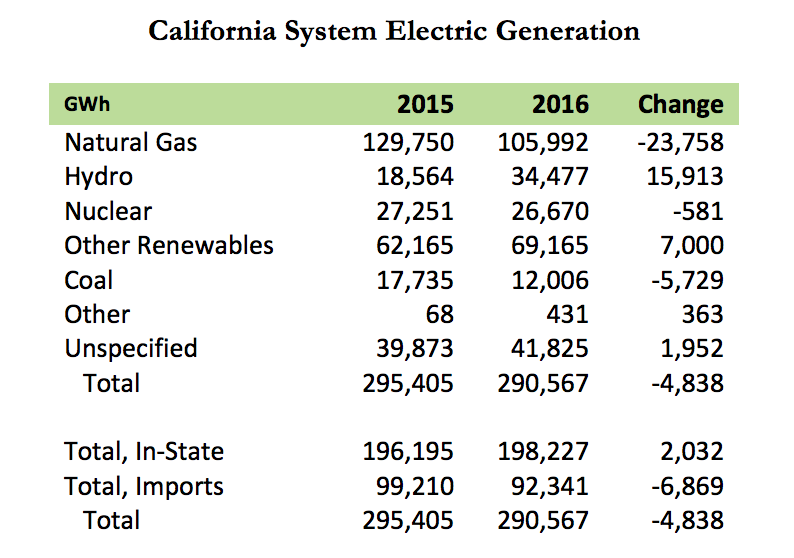
Data from the Energy Commission, shown in the table above, instead indicates that increased generation from hydropower was the major contributor. Natural gas fired generation dropped 23.8 TWh, but two-thirds of this reduction was made possible through increased hydro output. Furthermore, most of the additional hydro (12.6 TWh) was through in-state generation at large hydro plants—a GHG-free generation source that is excluded from the state’s renewable portfolio standard but that has been a key factor in the state’s long-running lower GHG per capita ranking.
The more recent 2017 data from the Energy Commission shows this trend continued into 2017. Favorable weather allowed hydro to grow another 16.4 TWh, more than double the 7.7 TWh incremental contribution from other renewables.
It’s the Jobs
The second primary source came from an 8% emissions drop from Oil & Gas: Production & Processing. These cuts are directly associated with job losses as production continues to contract in the state—according to US Energy Information Administration, 2016 saw an 8% drop in in-state oil production and a 13% drop in natural gas production. Job losses (extraction and support activities) coming from these emission reductions totaled 3,900 (19%) in 2016, comprising largely blue-collar employment in an industry paying average annual wages of $150,400.[4]
In addition to these direct oil and gas losses, the Emissions Inventory also shows a significant 0.98 MMTCO2e reduction from Cogeneration Heat Output. The associated Trends report (p. 11) indicates much of this amount is also related to lower oil and gas production activity:
Several cogeneration facilities, most of them associated with oil and gas operations, have either shut down or become non-operational in recent years and further contributed to the downward trend in cogeneration emissions.
California’s Emissions Record Similar to Nation as a Whole
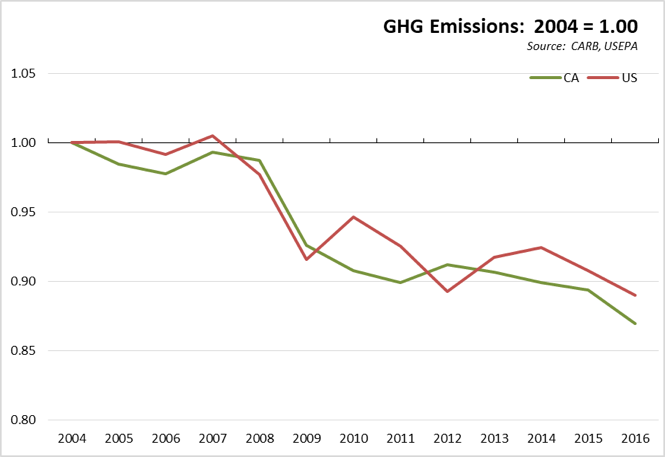
California’s climate change policy model—heavily reliant on direct regulation of most sectors of the economy—has produced results that are not substantially different from the emissions trendline for the nation as a whole:
- California reduced its GHG emissions by 2.7% in 2016. US EPA data[5] shows total US emissions dropped 1.9%.
- In 2016, California’s emissions were at 87% of the 2004 level. US emissions were at 89%.
- In 2015, California’s emissions were 2.4% above the goal of returning to the 1990 level, and in 2016—helped primarily by the weather and job losses—were 0.4% below. In 2016, US emissions were 2.4% above the 1990 level and on course to push below primarily as a result of market-based factors.
It can be argued that the California policy model has not produced emission cuts that are substantially different from those happening for the nation as a whole. A core difference is that the national trend lags California by about a year. An even bigger difference is in the cost of these two policy models.
Substantially Higher Costs to California Consumers and Employers
Governor Brown has conceded that California’s climate change program will have no discernible effect on global emissions if the state continues acting alone, but can only succeed if it’s a model that other states and countries adopt. To date, however, none have adopted this approach in full. Others have selected elements in name but left it to California to carry the economic costs—for instance, other states that adopted the state’s ZEV standards but that have relied on credits for ZEVs sold in California to reach their regulatory goals—while others such as Ontario are starting to leave.
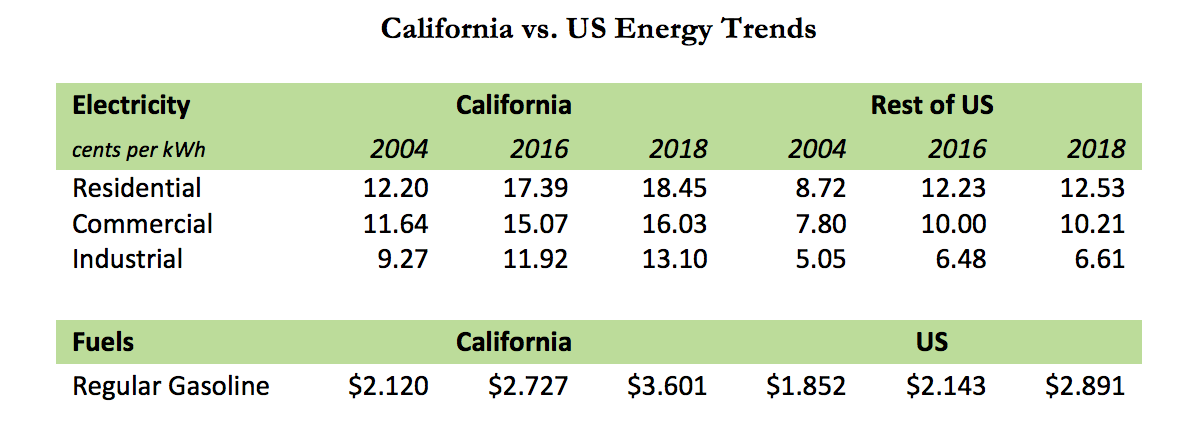
Source: US Energy Information Administration; 2018 is average for 12 months ending April for Electricity and June 2018 price for gasoline.
A key barrier is the cost of California’s high-regulation approach. The table above illustrates these costs through the rise in energy prices affecting consumers and employers. Recent estimates by the Center[6] put total costs to consumers and employers from the regulatory components of these growing prices at $5.0 billion related to electricity and $7.5 billion related to fuels in 2016. These amounts have continued to grow as prices have continued to rise. These amounts, however, are only part of the picture and do not reflect the continuing effect of state regulations on growing housing costs, increased commute times, and higher prices for many consumer goods.
Emissions Inventory Tells Only a Part of the Story
The numbers in the reported inventory do not cover all emissions tracked by CARB in the state, but instead essentially cover those under the state’s potential regulatory control. Major exclusions include interstate/international transportation by air and water—emissions that grew 4.49 MMTCO2e in 2016—and releases associated with wildfires that in a normal fire year can easily match the regulatory reductions and greatly exceed them in high fire years during or following a drought.
Wildfires affect GWG at three primary stages: emissions from the fire itself, longer-term emissions as dead and dying trees decompose, and loss of carbon storage as burned acreage—in the absence of proper management—shifts to lower quality forest land, chaparral, or grassland. A UC Berkeley study[7] estimated that that carbon losses from forests and wildlands—two-thirds of which were from fires—were as much as 5 to 7 percent of carbon emission for all state sources between 2001 and 2010. Compared to 1.5 MMTCO2e reduced through California’s program in 2015, fires on federal lands released an estimated 22.8 MMTCO2e, and the estimates for 2013 were 3.89 MMTCO2e and 22.4 MMTCO2e, respectively.[8]
The absence of proper forest management continues to rise from inadequate funding, the drastic decline of sustainable harvesting that can renew and rebuild these carbon sinks, and a policy framework driven almost exclusively by litigation at the federal and increasingly the state levels. While debates continue over the influence of climate change on fire levels worldwide, both the number and scale of fires within the state can be addressed through increased management attention at the same scale the agencies now devote to emission sources as diverse as electric stoves and cow flatulence and through increased funding through sources such as cap-and-trade that are now applied to measures with far less—and in some cases, if any at all—effect on the state’s total emissions.
Observations
- In launching California’s climate change policies, AB 32 required the state to consider the “maximum technologically feasible and cost-effective reduction” of GHGs. The reliance on external factors such as favorable weather and jobs destruction to demonstrate emission reductions in 2016 suggests neither part of this test has been achieved.
- Furthermore, the US as a whole has managed to sustain emission reductions comparable to California’s but at far lower cost. This situation suggests that in their rush to enact measures in accordance with the first part, the state agencies have given far less consideration to the cost-effective component. The result has been soaring costs throughout the California economy, beginning with energy and continuing on to housing and other basic costs of living.
- The consequences to the state is that few are rushing to adopt California’s model in full. While many have been willing to sign on to general statements of agreement, outside more “command and control” economies such as China, none have been willing to replicate close to the full range of regulatory controls—and related costs—over an equal range of their economies. And even in the case of China, a true comparison cannot be made in light of that country’s willingness to pursue massive expansions of technologies such as natural gas—for both energy and transportation—nuclear, and hydro after a true test of cost-effectiveness, and avoid the high costs they have seen resulting from California’s more ideological concentrations on the technologically feasible part of the equation.
[1] CARB, “Climate Pollutants Fall Below 1990 Levels for First Time,” Press Release, July 11, 2018.
[2] CARB, California Greenhouse Gas Emissions for 2000 to 2016, July 2018.
[3] CARB, “Climate Pollutants Fall Below 1990 Levels for First Time,” Press Release, July 11, 2018.
[4] Quarterly Census of Employment & Wages.
[5] US EPA, Inventory of US Greenhouse Gas Emissions and Sinks, 1990-2016.
[6] California Center for Jobs and the Economy, California Green Jobs: An Updated Review: Phase I Estimates, May 2018.
[7] Gonzalez, Patrick, John J. Battles, Brandon M. Collins, Timothy Robards, David S. Saah, “Aboveground Live Carbon Stock Changes of California Wildland Ecosystems, 2001-2010,” Forest Ecology and Management, Volume 348, July 15, 2015.
[8] Cited in: “Huge Wildfires Can Wipe Out California’s Greenhouse Gas Gains,” San Francisco Chronicle, December 7, 2015.
