The extent of the state’s two-tier economy is sharply illustrated by the patterns of economic growth over the past quarter century in two of its key jobs centers: Los Angeles County and the Bay Area.
In their March 2014 report, UCLA Anderson Forecast noted that “L.A. [County] has gone 23 years without positive job growth.” From December 1990 to December 2013, this report showed Los Angeles County was one of only two metropolitan areas in the US to show a decline in its job base, losing 3.1% of Nonfarm Wage & Salary Jobs over this period.
The following summary revisits this analysis based on the recent release by Employment Development Department (EDD) of the revised March 2014 benchmark jobs data. To put these numbers into perspective, jobs growth since 1990 is compared for both Los Angeles County and the Bay Area.
This comparison is useful from two policy perspectives. First, these are the two largest job centers in the state’s economy, but with two very different recent economic performance records. The Bay Area leads the state in employment growth, with unemployment rates below full employment levels. The much larger Los Angeles County has been much slower to recover, and due its size, continues to affect the overall state numbers.
Second, the economies in these two regions are being driven by contrasting industry structures. Bay Area growth has been led by the expansion—at least in the Bay Area—of Silicon Valley and related information industries which, until recently, have been subject to far less direct regulation and which pay the high salaries employees require to cope with high housing prices, growing energy costs, and other costs of living. The economy of Los Angeles represents a more traditional industry mix but one which at least in the past continued to provide upward mobility opportunity through its constant reinvention in response to economic change. This more traditional industry mix is also marked by industries that have been more directly impacted by the state’s ever-growing regulatory, tax, and energy costs. While facing relatively fewer higher wage job opportunities, workers in this region still must cope with the state’s higher housing, energy, commuting, and other regulatory-driven high costs of living.
Due to data availability, the regions used in this analysis differ slightly from the Go-Biz regions used elsewhere in the Center’s reports: (1) Bay Area includes San Benito County in addition to the Go-Biz definition of the Bay Area (an addition which affects the job totals by less than 1%) and (2) the Los Angeles numbers are only for Los Angeles County.
The jobs data used below is based on EDD’s recently revised average annual data rather than the monthly, year-over-year data used in the Anderson Forecast report. Consequently, the numbers differ slightly, although the overall conclusions do not.
Los Angeles: Nonfarm Jobs Declined 1.2% between 1990 and 2013; Slight Gain in 2014
| LA | Bay Area | |
|---|---|---|
| Population Growth (%) | ||
| 1990-2013 | 13.0 | 22.8 |
| 1990-2014 | 13.8 | 24.1 |
| Nonfarm Jobs Growth (%) | ||
| 1990-2013 | -1.2 | 16.8 |
| 1990-2014 | 1.1 | 21.2 |
| Private Nonfarm Jobs Growth (%) | ||
| 1990-2013 | -1.6 | 20.4 |
| 1990-2014 | 0.9 | 25.3 |
| Nonfarm Jobs per 1,000 Population | ||
| 1990 | 472 | 487 |
| 2013 | 413 | 463 |
| 2014 | 419 | 476 |
| Private Nonfarm Jobs per 1,000 Population | ||
| 1990 | 410 | 411 |
| 2013 | 357 | 403 |
| 2014 | 364 | 415 |
Jobs performance based on the annual averages for the two regions is summarized in the table above. Between 1990 and 2013, Los Angeles County grew 13.0% in size, but saw its nonfarm jobs base shrink by 1.2%. Combining these two factors, the relative availability of nonfarm jobs in Los Angeles went from 472 per 1,000 population in 1990 to 413 in 2013, a drop of over 10%. In this same period, nonfarm jobs growth better kept pace with population growth in the Bay Area, producing only a slight drop in the relative availability of jobs.
In 2014, Los Angeles finally showed a positive increase over the 1990 job levels, with 0.9% growth over the 24-year period. Job growth in the Bay Area, however, continued stronger and brought the region closer to a job creation level keeping pace with its population growth.
Private Jobs Growth Stronger in the Bay Area
Looking at the total nonfarm and private nonfarm growth rates in the table above, Los Angeles relied much more heavily on government jobs growth to sustain its jobs near the 1990 level. The Bay Area’s private job creation through 2014 of 25.3% in fact outpaced population growth during this period.
Los Angeles: Private Jobs were Below 1990 Levels in Every Year Between 1990 and 2013
In 2014, Los Angeles showed a net gain of 32,800 nonfarm jobs over the 1990 level. As indicated in the chart below, this was only the 4th time since 1990 Los Angeles had shown such a positive gain.
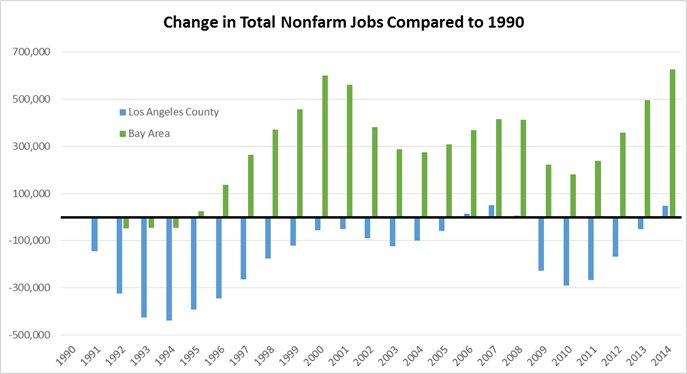
Netting out government jobs—as shown in the following chart—produces a much more dramatic result. In this case, 2014 not only produced a slight net increase over the 1990 job levels, it was in fact the first time in 24 years Los Angeles had experienced any positive growth in private jobs.
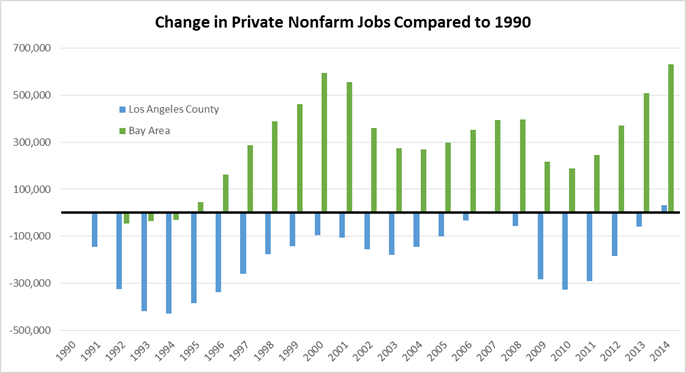
While these charts show Los Angeles in essence still struggling to achieve a jobs recovery from the 1991 recession, the situation for the Bay Area is markedly different. For this region, much of the recent jobs growth has been to recover ground lost in the 2001 recession. Strong jobs performance in 2014, however, is the first year that took the Bay Area beyond this point.
Jobs Recovered Are Not the Same Jobs Lost
While 2014 marked a return to positive jobs growth in both regions—Los Angles from 1990, Bay Area from 2000—the pattern of jobs growth again differs markedly.
In the charts below, jobs by industry have been aggregated into the following wage categories to provide greater ease in the presentation. All wage levels are based on the most recent, 2014 Q3 average annual wages by industry (California averages) from the Quarterly Census of Employment & Wages, a statistic that incorporates both wage levels and average hours worked. The industries and average annual wage within each category are as follows:
- Higher Wage: Professional & Business Services ($73,372), Financial Activities ($79,196), Information ($124,540).
- Health Care: Health Care Services ($58,903). This industry was broken out separately due to its high growth in recent years and the fact it combines both traditional middle class occupations as well as high-wage professionals.
- Middle Class Wage Blue Collar: Transportation, Warehousing & Utilities ($55,766), Construction ($57,096), Wholesale Trade ($67,964), Manufacturing ($75,972), Mining & Logging ($115,388). Note that this category includes the second highest industry wage, as a result of the inclusion of oil and gas workers.
- Other Middle Class Wage: Arts, Entertainment & Recreation ($43,680), Educational Services ($47,424)
- Lower Wage: Retail Trade ($33,124), Other Services ($33,956)
- Very Lower Wage: Social Assistance ($16,796), Accommodation & Food Services ($20,124). Social Assistance was broken out separately as it is dominated by In-Home Supportive Service positions that were first added to the jobs data base in the 2013 data revisions.
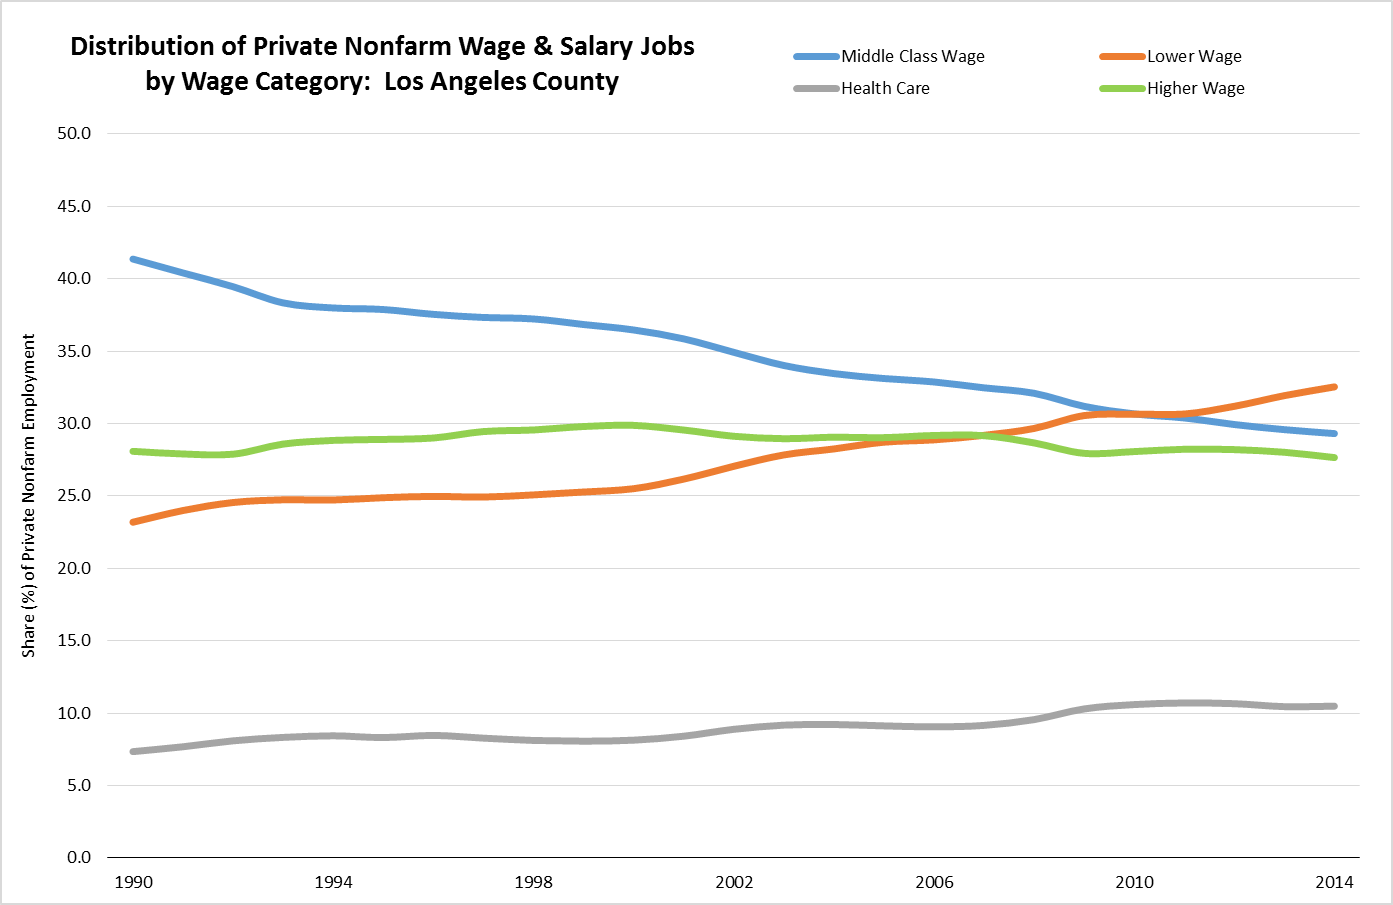
Based on these categories, the changing mix of private jobs by wage level is shown in the following chart for Los Angeles County. Keeping in mind that the number of jobs roughly remained the same throughout this period, the story shown in this chart is a direct replacement of middle class wage jobs with jobs in the two lower wage categories. Combined, the share of Middle Class Wage Other and Middle Class Wage Blue Collar went from 41.3% in 1990 to 29.3% in 2014. Higher Wage jobs changed relatively little, from 28.1% in 1990 to 27.7% in 2014. The bulk of the drop in middle class jobs was instead replaced by the two lower wage categories, which went from 23.2% in 1990 to 32.5% in 2014.
Private Nonfarm Jobs Distribution by Wage Level (%)
| LA | Bay Area | ||||
|---|---|---|---|---|---|
| 1990 | 2014 | 1990 | 2014 | ||
| Higher Wage | 28.1 | 27.7 | 28.4 | 33.1 | |
| Health Care | 7.4 | 10.5 | 7.6 | 9.4 | |
| Middle Class Wage Other | 3.9 | 5.4 | 3.0 | 4.3 | |
| Middle Class Wage Blue Collar | 37.4 | 23.9 | 34.3 | 23.3 | |
| Lower Wage | 15.0 | 15.4 | 17.0 | 15.1 | |
| Very Lower Wage | 8.2 | 17.1 | 9.7 | 15.0 | |
| Total | 100.0 | 100.0 | 100.0 | 100.0 | |
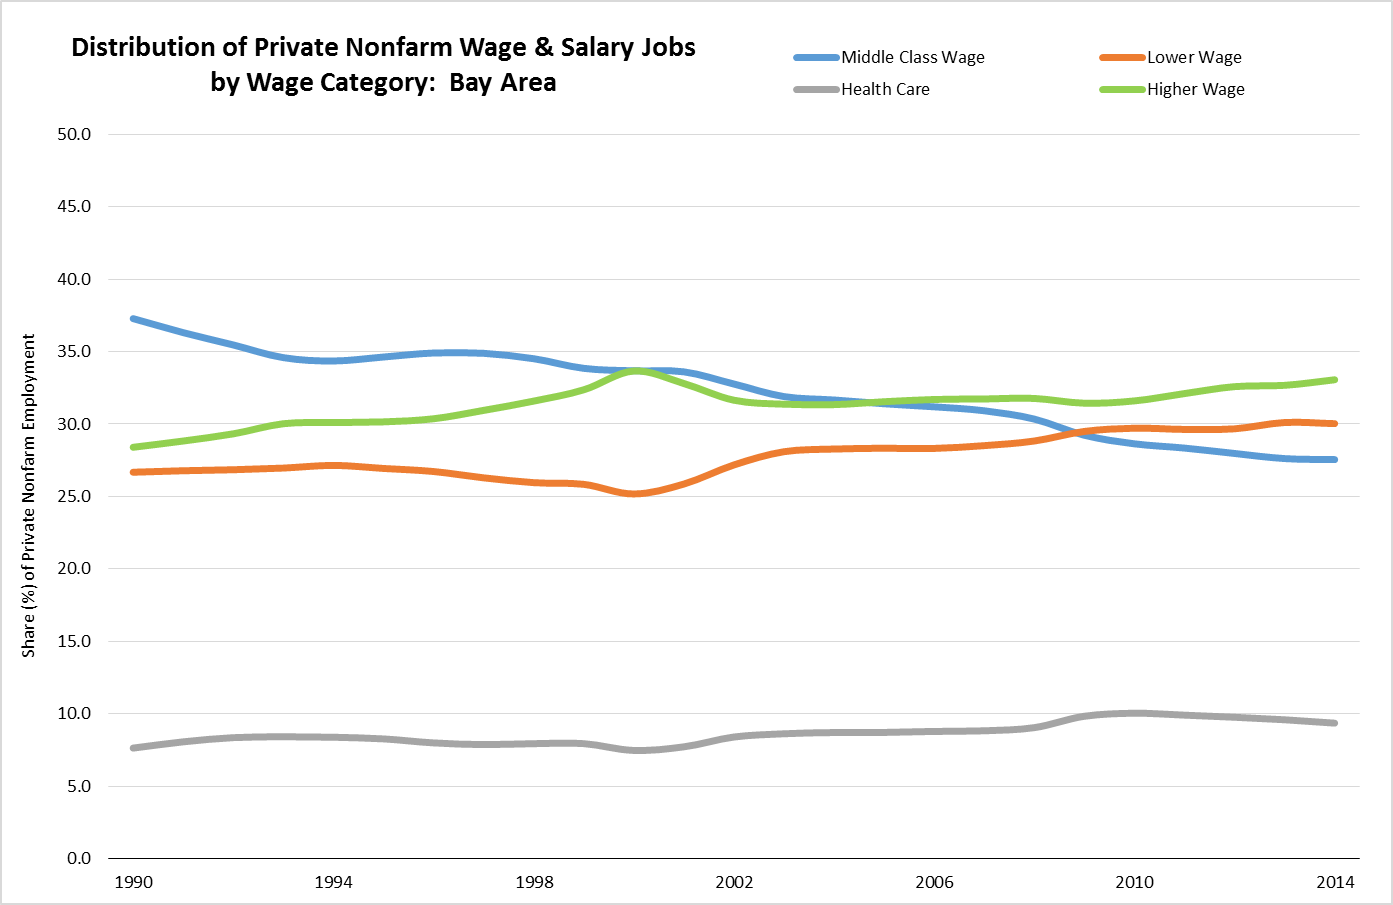
Bay Area has seen the same shrinkage of middle class jobs as a percentage of the overall jobs mix. The two middle class categories have gone from 37.3% in 1990 to 27.6% in 2014. Unlike Los Angeles, however, the Bay Area situation is more a failure to create these middle class jobs at the same pace as overall jobs growth. The total number of jobs in the two categories have instead contracted less severely than in Los Angeles, from 913,500 in 1990 to 841,000 in 2014.
Bay Area job creation instead has been dominated by the higher and lower wage categories that have further eroded the middle class job share as these categories have expanded the overall jobs total. Higher wage jobs expanded from 28.4% in 1990 to 33.1% in 2014, while growing a total of 313,500 jobs. The two lower wage categories at the same time went from 26.7% in 1990 to 30.1% in 2014, with a net increase of 263,300 jobs.
Note that due to data disclosure limitations, a complete breakdown by industry is not available for all the component MSAs in the Bay Area, and percentages for the chart above were calculated based on the available data totals. This factor, however, has only minimal effect on the category shares as the amount subject to these limitations did not exceed 1.8% in total in any year.
Jobs Growth in 2015
The preliminary March 2015 data from EDD indicate continued jobs growth in both regions. Compared to the 2014 annual average, Los Angeles County added another 82,700 nonfarm jobs (61,800 private jobs) as of March 2015, and Bay Area added 83,200 nonfarm jobs (71,300 private jobs). These results again show job creation dominated more by the private sector in the Bay Area.
In Los Angeles, 40% of the net private jobs created were in the two lowest wage categories; while in the Bay Area, 59% of the net new jobs are in the higher wage category.
Note that while the March 2015 numbers illustrate the current trend of jobs growth in the two regions, they are unadjusted monthly numbers that reflect seasonal factors and are also subject to revision. A complete comparison based on this analysis will not be available until the annual average series is updated next year.
Conclusions
A comparison of these two regions illustrates two contrasting trends that have contributed to the state’s emerging two-tier economy and its continuing contraction of upward mobility opportunities.
The Bay Area, by far the state’s dominant growth center at present, is an example of California’s historic practice of pioneering new industries to spur recurring rounds of economic expansion. The key difference, however, is that the region has not seen the same growth in the ancillary back office, support, manufacturing, and other middle class wage jobs as has happened under similar expansions in the past. Recent job creation in the Bay Area instead has concentrated in the higher wage jobs of the expanding new industries, and the lower wage primarily population-serving service jobs related to that growth. Jobs growth also has been heavily focused within the Bay Area—accounting for 60% of the state’s net employment gains since 2007—rather than significant diffusion to date to other regions of the state.
Los Angeles presents a trend largely of jobs stagnation under which middle class wage jobs have been steadily replaced by lower wage service jobs for a population that has continued to grow. Rather than reinvent its economy in response to the changing economic conditions as it has in the past, the region instead has reshaped its economic structure with a severe contraction of the middle class wage jobs that long provided new economic opportunities to prior generations.
This decline in middle class wage jobs and the associated growing income divide has led to considerable policy interest in recent years on both the state and local levels. Many of the policy prescriptions to date, however, have been more palliative, responding to the results of growing income inequality and the state’s rising costs of living rather than addressing the root causes.
Faced with similar economic challenges in the past, the state has often looked to reshape the competitive factors standing in the way of broader-based growth, whether it was bringing water to the coastal cities at the beginning of the 20th Century, the infrastructure and higher education investments in the 1960s, or subsequent efforts in succeeding recessionary periods to reform competitive barriers raised by the state’s regulatory, tax, education, and other government policies. To fully address the growing income gaps facing the state today, comparable efforts are needed if the state is to be able to take actions that can promote a broader range of wage opportunities and tackle the growing income gaps at their source.