Below are highlights from the recently released trade data from the US Census Bureau and US Bureau of Economic Analysis.
Imports through California’s ports continued to surge as companies continue to rebuild inventories and attempt to strengthen inventories in anticipation of persistent supply disruptions, coming at the same time trade activity entered the traditional period of stocking to meet anticipated holiday demand. Nominal exports were 0.5% off pre-pandemic August 2019 levels, while imports were up 10.8%.
Trade levels remained heavily affected by blockages throughout the supply and logistics chains. As of October 4, the Marine Exchange reported 84 ships (62 container ships) at anchor or drift off the San Pedro Bay ports, compared to 64 a month ago and a recent high of 95 in the past month. Congestion, however, is not just limited to California but is also severe in other ports throughout the US. As noted by Commissioner Carl Bentzel of the Federal Maritime Commission in a presentation to the recent meeting of CalChamber’s International Trade group, “This is the largest shipping meltdown since WWII.”
Port congestion is not a new issue, but has been growing since last November. Compounding this situation are various other factors as well, including:
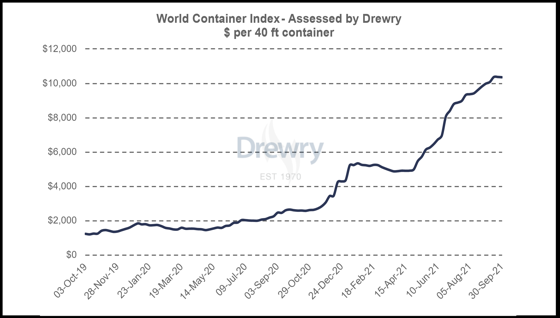
- Shipping costs have risen sharply. The Drewry composite World Container Index is up 292% over the year. Drewry’s weekly spot freight rates from Shanghai to Los Angeles are up 198% to $12,172, and even the less traveled export route from Los Angeles to Shanghai is up 167% to $1,383. These much higher costs are working their way into the supply chain, with transportation costs rising from their previous fractional level to a higher share of the total cost of products sold in the US, contributing further to rising inflation levels.
- Energy shortages and rising energy prices in China due in large part to recent changes in the country’s climate change policies are causing production to be curtailed in many regions just as companies were ramping up for the holiday crush. Prices consequently are rising along with renewed supply shortages. For example, China produces 70% of all solar panels, and the current disruption is leading to increased costs and delays for installation projects worldwide.
- The shortage of truck drivers further adds to delays and costs as goods are eventually moved through the ports. The shortages are so severe that the current version of federal infrastructure bill approved by the Senate includes a provision allowing teenagers aged 18 to 20 to drive tractor-trailers across state lines. Continued chassis shortages at the ports have added to shipping delays.
- The publicly-operated delivery service—USPS—has failed to rise to the occasion by recently announcing both a slow-down in services and increase in rates. Rather than fixing what it should be doing, USPS instead has quietly sought to broaden its functions by launching a check-cashing service as an initial foray into public banking.
The immediate consequences of this situation are being felt as additional pressures on the rapid rise in inflation in recent months, likely to be compounded in the coming months as increased savings fueled in large part by the various pandemic assistance payments chase scarcer goods during the upcoming holiday season. More lasting, continued and now rising supply shortages will continue to be a brake on jobs recovery within many industries and the supply and service businesses that support them.
California Goods Exports
Total California goods exports were up $1.8 billion from August 2020 (up 13.8%). California remained in 2nd place with 10.44% of all US goods exports (12-month moving total), behind Texas at 20.39%. August 2020, however, was still in the period when exports were heavily affected by the pandemic lockdowns both here and in other states and countries. Compared to pre-pandemic August 2019, exports were off 0.5% in nominal terms and more substantially in real terms.
California's Balance for Goods Trade
Reflecting the continuing surge in imports and more gradual recovery in exports, California’s balance of goods trade activity through state businesses broadened to -$26.1 billion, compared to a level of -$23.4 billion in August 2020. California trade accounted for 27% of the US trade deficit in goods in August 2021.
Top 20 Exports, August 2021
Top 20 exports by value are shown below, along with the change from August 2020.