Below are highlights from the recently released trade data from the US Census Bureau and US Bureau of Economic Analysis. To view additional data and analysis related to the California economy visit our website at www.centerforjobs.org/ca.
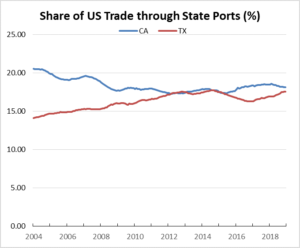
Share of Goods through US Ports
Total US goods trade (exports and imports) through California ports edged up to 18.16% (12 month moving average; compared to 18.14% in Nov 2018 and 18.48% in Dec 2017).
California remained the #1 state, ahead of Texas with 17.56% (compared to 17.57% in Nov 2018 and 16.91% in Dec 2017). Trade through the Atlantic port states was at 29.31% (compared to 29.27% in Nov 2018 and 29.3% in Dec 2017). The state’s continued lead in this area forms the trade-related base for one of California’s largest centers of middle-class, blue-collar jobs. Transportation & Warehousing alone provided 629,600 jobs in Dec (up from 602,400 in Dec 2017), paying an average annual salary of $55.8k. This employment base in turn supports additional blue-collar and white-collar jobs in a range of other industries.
As shown in the chart below, the state’s lead in this sector, however, is down substantially from prior years.
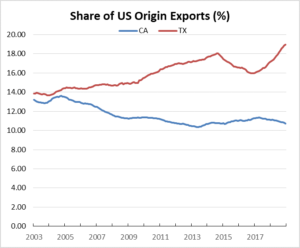
California Goods Exports Decrease
Total California goods exports were down $1.3 billion from Dec 2017 (down 8.7%). California remained in 2nd place with 10.72% of all US goods exports (12 month moving total), behind Texas at 18.96%.
California's Balance for Goods Trade
California’s balance of goods trade through state businesses narrowed slightly to -$22.9 billion, compared to a level of -$23.0 billion in Dec 2017. California trade accounted for 31% of the US trade deficit in goods in Dec 2018.
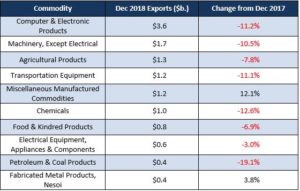
Top 10 Exports, December 2018
Top 10 exports by value are shown below, along with the change from Dec 2017. As markets continued to erode for recycled materials in particular as a result of China’s actions, Waste & Scrap dropped out of the Top 10 list when ranked by value but remained #2 when measured by weight.
By shipping weight (vessel and air total), the leading export was Petroleum & Coal Products at 1.2 billion kg (35% of total exports), followed by Waste And Scrap at 1.0 billion kg (29%), and Agricultural Products at 0.4 billion kg (12%).
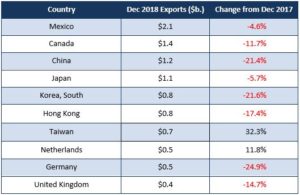
Top 10 Export Markets, December 2018