Below are highlights from the recently released trade data from the US Census Bureau and US Bureau of Economic Analysis.
The July trade figures, in general, continue to show a degree of recovery when compared to the 2019 pre-pandemic levels, but only regaining ground rather than moving forward. On an annualized basis, import flows were up 3.1% annually from 2019 in nominal terms, and export flows up 3.3%. In real terms, both were essentially unchanged.
The current period moving into the fall is generally one of high activity as businesses begin to raise inventories for the holiday season in the US and shippers work around the upcoming October National Day Golden Week holiday in China. Trade disruptions, however, continue to worsen. Congestion in the Southern California ports remains high, with 40 container ships and 64 total waiting at anchor as of September 1. Renewed port shutdowns in China due to COVID, however, introduce a significant new factor of rising uncertainty in the trade outlook.
Congestion is not limited to California, with other ports in the US experiencing similar delays, compounded by shortages in trucking and cascading congestion within the rail systems. Combined with the renewed production and shipping delays in China, logistics blockages are having wider effects on domestic production as well, leading to a rise in work-in-progress inventories rather than finished production for delivery. Job numbers in the upcoming months consequently will be affected as temporary shutdowns occur due to shortages in component supplies. Continuing shortages in both imported and domestic goods production will continue to feed inflation during this period.
Share of Goods through US Ports
Through US Ports
The share of total US goods trade (exports and imports) through California ports continued its downward trend to 17.83% (12-month moving average; compared to 17.96% in June 2021 and 17.59% in July 2020).
California remained the #1 state, ahead of Texas with 17.34% (compared to 17.26% in June 2021 and 17.34% in July 2020). Trade through the Atlantic port states was at 30.38% (compared to 30.43% in June 2021 and 30.43% in July 2020).
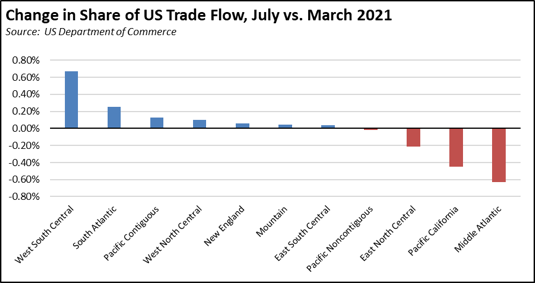
Compared to California’s near-term high in March, trade activity measured by value has shifted more to the Gulf and South Atlantic ports and to a lesser the Pacific Northwest. As noted by Pacific Merchant Shipping Association, this trend is not yet necessarily an indication of shifting competitive factors, but likely reflects the fact that the disruptions stemming from the situation in the China ports require an additional month of steaming time to affect the data.
California Goods Exports
Total California goods exports were up $1.5 billion from July 2020 (up 11%). This number still reflects an element of lower trade activity related to pandemic factors but to a far lesser extent than in prior months. Compared to July 2019, origin exports were up by $1.4 billion. California continued its downward trend but remained in 2nd place with 10.53% of all US goods exports (12-month moving total), behind Texas at 20.07%.
California's Balance for Goods Trade
California’s balance of goods trade activity through state businesses broadened to -$25.1 billion, compared to a level of -$23.0 billion in July 2020. California trade accounted for 27% of the US trade deficit in goods in July 2021.
Top 20 Exports, July 2021
Top 20 exports by value are shown below, along with the change from July 2020.