Below are highlights from the recently released trade data from the US Census Bureau and US Bureau of Economic Analysis.
California origin exports were up sharply by 14.9% compared to March 2021, and 8.5% compared to the pre-pandemic level in March 2019. While significant in nominal terms, adjusting for inflation instead shows that the state’s exporters are still short of recovery as renewed lockdowns in China and increasing global disruptions from Russia’s war on Ukraine affect the state’s markets.
Trade activity, however, continued to be dominated by imports which were higher than March 2019 by more than a third in nominal terms and by nearly a fifth in real terms. Imports continued to be driven both by the need to replenish gaps in the supply chains as well as inventory build ups in anticipation of West Coast labor actions this year.
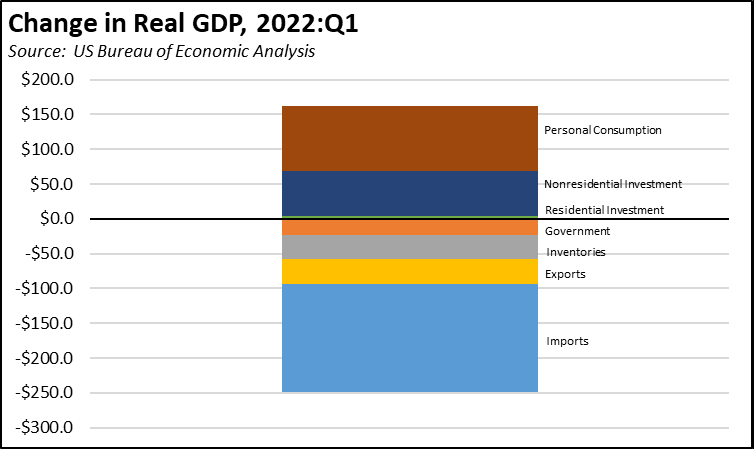
The rise in imports is also reflected in the recent GDP results for the first quarter of the year. Personal consumption (increase almost all due to services rather than goods) and business investment (almost all due to equipment and intellectual property rather than buildings) both showed substantial growth in the quarter, in part due the lasting effect of above-average savings during the pandemic due to lower overall consumption especially services and the lingering effect of the various federal pandemic assistance payments. The recorded overall drop in the quarter instead came from a draw down of inventories rather than expanded production to meet demand, a dip in exports as global trade disruption began to grow, and a surge in imports rather than domestic production.
Supply chain disruptions continued to affect overall trade levels as well as domestic manufacturing and general sales. There were some signs of easing. As of April 29, the total backup off the Ports of Los Angeles and Long Beach was 44 container ships, compared to 71 container ships and 108 total ships at anchor or loitering off the ports on October 20, 2021 when the state issued its measures to tackle the ongoing supply chain issues.
These improved results do not necessarily reflect the outcome of actions on this side of the Pacific. New blockages in global supply chains have arisen from the near-total lockdown of Shanghai, actions that now appear to have the potential to spread to other parts of China. The war in Ukraine has caused shipping rates to remain elevated due to higher fuel prices, while other shortages especially in food, strategic minerals, and other commodities due to the war are a looming threat adding to sustained inflation over an extended period. The threat of a West Coast labor action creates further uncertainty for the coming months. In other words, the current numbers suggest a possible light at the end of the tunnel, but that light may instead just be the entry to another one.
California Goods Exports
Total California goods exports were up $2.2 billion from March 2021 (up 14.9%). California remained in 2nd place with 9.82% of all US goods exports (12 month moving total), behind Texas at 22.28%.
California's Balance for Goods Trade
California’s balance of goods trade activity through state businesses broadened to -$30.4 billion, compared to a level of -$23.4 billion in March 2021. California trade accounted for 26% of the US trade deficit in goods in March 2022.
Top 20 Exports, March 2022
Top 20 exports by value are shown below, along with the change from March 2021.