Download Report
Below are highlights from the recently released trade data from the US Census Bureau and US Bureau of Economic Analysis.
The October data indicated weakening across all trade measures as exports from China continued to be hampered by that country’s lockdown strategies, importers continued to adjust inventory management, and as international economic conditions remained unsettled. Origin exports were down from October 2021 and up only 1.5% in nominal terms from pre-pandemic October 2019. Destination imports were up 2.9% in nominal terms (down in real terms) from the prior year, but still expanded 18.9% from October 2019. Overall trade flows through the state’s ports were up only 1.5% (down in real terms) from October 2021, while both the state’s share of total US trade flows and share of origin exports continued to erode.
As measured by the New York Federal Reserve Global Supply Chain Pressure Index, supply congestion saw only minor change in the latest month but still remained somewhat elevated from prior periods.
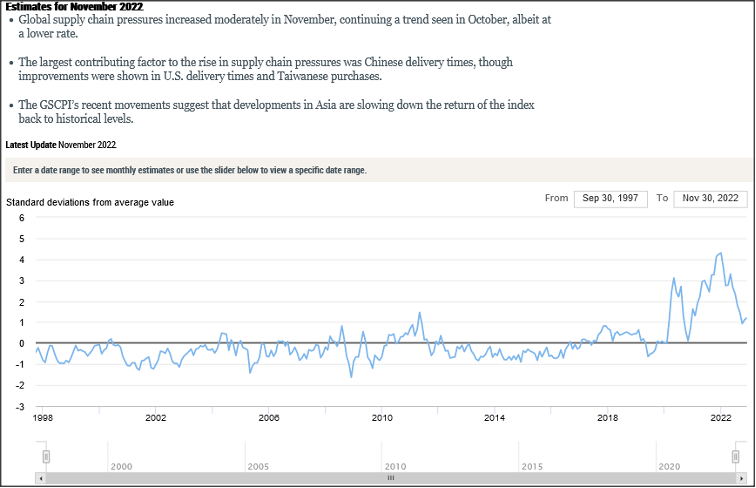
Source: New York Federal Reserve
Within California, recent reports indicate backups off the San Pedro ports have largely ended, although November still saw days with some container ships at anchor or loitering. While the immediate threat of a national rail strike was resolved through Congressional action, the West Coast port talks still are ongoing.
Share of Goods through US Ports
16.1%
CA Share Of Total Trade
Through US Ports
The share of total US goods trade (exports and imports) through California ports continued dropping to 16.14% (12 month moving average; compared to 16.27% in September 2022 and 17.42% in October 2021). California’s trade position has been eroding consistently since reaching its near term high of 18.27% in March 2021, and longer term is down from previous highs of around 20% at the beginning of the 2000s.
California remained the #2 state, behind Texas with 19.58% (compared to 19.48% in September 2022 and 17.74% in October 2021). Trade through the Atlantic port states was at 29.60% (compared to 29.55% in September 2022 and 30.31% in October 2021).
While dropping in relative terms, the state’s continued strength in this area forms the trade-related base for one of California’s largest centers of middle-class, blue-collar jobs. Transportation & Warehousing alone provided 795,800 wage and salary jobs in the latest data for October, the primary industry showing sustained growth during the pandemic with a gain of 130,700 since February 2020.
California Goods Exports
-$0.2
Billion Change In Exports
Total California goods exports were down $0.2 billion from October 2021 (down 1.2%). California remained in 2nd place with 9.07% of all US goods exports (12 month moving total), behind Texas at 23.53%.
California Goods Imports
$1.2
Billion Change In Imports
Total California destination goods imports rose $1.2 billion from October 2021 (up 2.9%).
Top 20 Exports, October 2022
Top 20 exports by value are shown below, along with the change from Oct 2021.
| NAICS Commodity |
Oct 2022 Exports ($b.) |
Change from Oct 2021 |
| Computer Equipment |
$1.0 |
1.6% |
| Semiconductors & Other Electronic Components |
0.9 |
-2.0% |
| Fruits & Tree Nuts |
0.9 |
-32.1% |
| Industrial Machinery |
0.8 |
-16.0% |
| Navigational/measuring/medical/control Instrument |
0.8 |
6.1% |
| Communications Equipment |
0.8 |
28.4% |
| Aerospace Products & Parts |
0.7 |
39.7% |
| Pharmaceuticals & Medicines |
0.7 |
-26.6% |
| Miscellaneous Manufactured Commodities |
0.7 |
-7.2% |
| Medical Equipment & Supplies |
0.5 |
6.3% |
| Motor Vehicles |
0.5 |
80.7% |
| Electrical Equipment & Components, Nesoi |
0.4 |
12.0% |
| Waste & Scrap |
0.4 |
-39.6% |
| Petroleum & Coal Products |
0.3 |
-16.5% |
| Basic Chemicals |
0.3 |
16.6% |
| Commercial & Service Industry Machinery |
0.3 |
33.8% |
| Other General Purpose Machinery |
0.3 |
19.4% |
| Foods, Nesoi |
0.3 |
-8.1% |
| Dairy Products |
0.3 |
47.7% |
| Motor Vehicle Parts |
0.3 |
17.7% |
|
|
|
Top 10 Export Markets, October 2022
| Country |
Oct 2022 Exports ($b.) |
Change from Oct 2021 |
| Mexico |
$2.8 |
10.9% |
| Canada |
1.8 |
0.1% |
| China |
1.7 |
-2.8% |
| Korea, South |
1.0 |
11.5% |
| Japan |
0.9 |
-16.3% |
| Taiwan |
0.9 |
2.7% |
| Hong Kong |
0.6 |
-5.2% |
| India |
0.5 |
-29.0% |
| Germany |
0.5 |
-30.3% |
| Netherlands |
0.4 |
-12.1% |
|
|
|