Below are highlights from the recently released trade data from the US Census Bureau and US Bureau of Economic Analysis.
Overall trade activity continued the pattern in recent months, but with the surge in imports continuing to outpace exports. Exports handled through the state’s ports were at their lowest level since February, and were up only 4.0% from September 2020 and up only 1.6% from pre-pandemic September 2019. In real terms using US CPI as the deflator, the export flow compared to September 2019 was down 4.9%. In contrast, the import flows—which outpaced the export flows by 3.2:1—surged 11.1% from September 2020 and 17.4% (9.9% real) from September 2019.
Trade activity, however, remains constrained by blockages throughout the supply chain. While the federal and state governments have announced steps to deal with the immediate issues affecting congestion in the state’s ports, the situation has gotten worse. The most recent reports show 101 ships at anchor or loitering off the Ports of Long Beach and Los Angeles, up from 84 in our trade report from last month.
As an indicator of growing problems in the broader supply chain, the Institute of Supply Management (ISM) reported its October Supplier Deliveries Index at 75.7%, the second-highest level ever (an Index over 50% indicates supply deliveries are slowing; below 50% that delivery times are improving). Critical supplies throughout the economy are not only slowing; they are doing so at a faster pace. The ISM report also indicated overall production activity, and consequently the related jobs, eased somewhat in the US, while factory gate prices were up, further adding to the current surge in inflation. Key components of the state economy, such as agriculture, now report that port congestion has left them with fewer means to sell their production.
In recent polling, more than a third of adults reported trouble securing housing, groceries, paper goods such as toilet paper and paper towels, and new cars. Just over half of adults choose not to purchase an item because of rising costs, while just over a quarter have cancelled an order because it was taking too long to deliver.
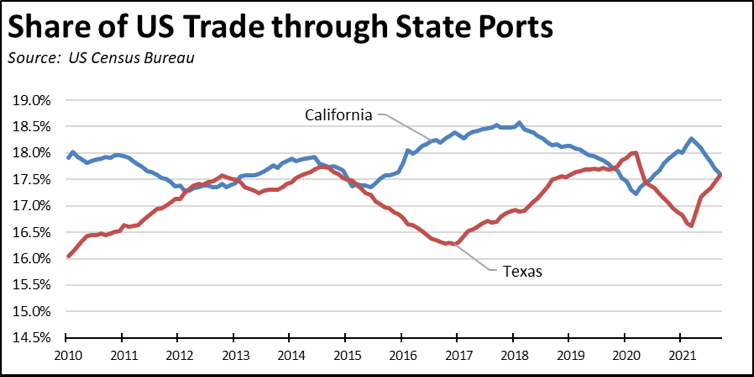
While the current surge in imports has helped maintain California as the largest state by total trade volume, the growing difficulties of shipping through California combined with growing costs have seen that lead eroding once again. Measured by container numbers, California retains the first and second largest ports in Los Angeles and Long Beach. Measured by total trade value, the longer trend is now shifting the number one spot back to Texas, which previously saw its growth dip in large part as the result of last year’s drop in oil prices.
Even within the green/clean energy jobs categories the state promotes within its policies if not in fact through concrete actions to grow these jobs beyond the 500,000 estimate that has been in official pronouncements since at least 2007, the relative positions are also slipping. Measured at the six-digit product code level, electric vehicles were the 4th largest product export for the broader period 2021 year to date, but fell to 37th when looking at only the September results as the primary exporter continues to expand production in other states and countries. Even at this ranking, electric vehicle exports at $3.1 billion year-to-date came in at only two-thirds the size of waste and scrap combined at $4.9 billion, as the outcome of the state’s green policies on recycling continues to ship the collected waste streams overseas rather than staying within California to create new manufacturing jobs.
California Goods Exports
Total California goods exports rose $1.2 billion from September 2020 (up 9.1%). California remained in 2nd place with 10.38% of all US goods exports (12 month moving total), behind Texas at 20.62%.
While trade levels had recovered to some extent in September 2020, both that month and the most recent results continued to be affected by the pandemic period factors, with September 2021 in particular hindered by growing congestion at the state ports and along the other points within the overall supply chain. Using pre-pandemic September 2019 as a more valid comparison point, state origin exports were up only 2.4% in nominal terms, but were down 4.2% in real terms using US CPI as the deflator.
California's Balance for Goods Trade
California’s balance of goods trade activity through state businesses broadened to -$28.5 billion, compared to a level of -$23.9 billion in September 2020. California trade accounted for 28% of the US trade deficit in goods in September 2021.
Top 20 Exports, September 2021
Top 20 exports by value are shown below, along with the change from September 2020.