Below are the monthly updates from the most current April 2024 fuel price data (GasBuddy.com) and February 2024 electricity and natural gas price data (US Energy Information Administration). To view additional data and analysis related to the California economy visit our website at www.centerforjobs.org/ca.
Electricity Prices Highest in the Nation
Last month, the governor announced that the state’s energy policies had set new records whereby clean energy had exceeded grid demand at some point during 40 of the last 48 days. Left unsaid, however, is that clean energy is not always produced when it is needed. When production exceeds demand as in those 40 days, one possible outcome continues to be that prices go negative and a portion of that production is wasted. The bureaucratic checklists get checked, but end users are left with paying the costs. To counter this waste, the state policies also require increasing battery storage additions to the grid, with the state reaching 10.4 GW of capacity last month as well. This approach reduces the need to “throw away” clean energy production, but in essence requires end users to pay for generation of the same energy twice.
The state’s policies, however, also set another record. In this case, electricity prices hit the trifecta of reaching the highest average price levels across all three major end uses—residential, commercial, and industrial—among the contiguous states. The state’s energy policies continue to reach new records for production. California energy users continue to see new records in the associated costs.
Inflation Rises in February
February 2023
For the 12 months ending February, the California CPI rose 3.3%, up from 2.7% in January. In the same period, the US CPI edged 3.2% from 3.1% in January.
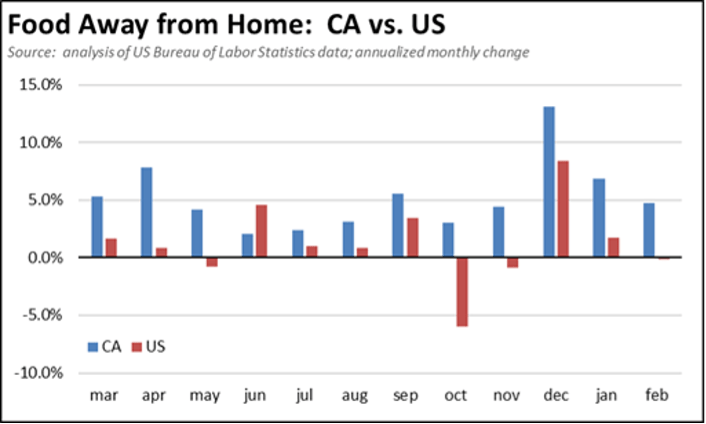
Using the same formula applied by Department of Finance in calculating the California CPI, Food Away from Home (restaurants and take out) continues to exhibit much higher price increases as business costs continue to rise especially for energy and labor. In advance of the higher costs yet to be incorporated in the data under the new $20 an hour minimum wage that began in April, Food Away from Home (restaurants and take-out) in California rose 5.2% over the year in February compared to only 1.0% for the US as a whole. On an annualized monthly basis, restaurant and take-out prices have been trending much higher in California. Note that the chart does not yet include the recent series of price increases announced as the new wage rules came into effect.
California Gasoline Taxes & Fees
Fees per Gallon
Of Gasoline
In April, California Energy Commission data indicates that $1.45 (28.2%) of the price of a gallon of regular gasoline was paid to cover state, local, and federal taxes and fees, the highest level in our current data series going back to 1999. The state tax portion is scheduled to rise another 2 cents beginning July 1. Diesel taxes will rise 1.3 cents.
California vs. Rest of US Diesel Price
Above Other States
(CA Average)
The April average price per gallon of diesel in California rose 3 cents from March to $5.42. The California regulatory and tax premium above the average for the US other than California ($3.93) rose to $1.49, a 38.1% difference.
price
In April, California again had the highest diesel price among the contiguous states and DC.
Range Between Highest and Lowest Prices by Region
above Other States
(Central Sierra Region)
The cost premium above the US (other than California) average price for regular gasoline ranged from $1.77 in the Inland Empire Region (average April price of $5.28), to $2.10 in Central Sierra Region (average April price of $5.61).
Highest/Lowest Fuel Prices by Legislative District:
California Residential Electricity Price
Rest of US
California average Residential Price for the 12 months ended February 2024 was 29.45 cents/kWh, 94.0% higher than the US average of 15.18 cents/kWh for all states other than California. California’s residential prices were the highest among the contiguous states and DC.
California Residential Electricity Bill
For the 12 months ended February 2024, the average annual Residential electricity bill in California was $1,729, or 73.9% higher ($735) than the comparable bill in 2010 (the year the AB 32 implementation began with the Early Action items). In this same period, the average US (less CA) electricity bill for all the other states grew only 21.3% ($291).
In 2010, California had the 9th lowest residential electricity bill among the contiguous states and DC. In the latest data, it tied with Nevada for the 15th highest.
Residential bills, however, vary widely by region. Transforming the 2022 data recently released by the Energy Commission, estimated annual household usage is as much as 82% higher in the interior regions compared to the milder climate coastal areas, and substantially higher when comparing across counties.
Average Price in
Other States
For the 12 months ended February 2024, California’s higher electricity prices translated into Residential ratepayers paying $11.8 billion more than the average ratepayers elsewhere in the US using the same amount of energy. Compared to the lowest cost state, California households paid $15.2 billion more.
California Commercial Electricity Price
Rest of US
California average Commercial Price for the 12 months ended February 2024 was 24.18 cents/kWh, 105.8% higher than the US average of 11.75 cents/kWh for all states other than California. California’s commercial prices were the highest among the contiguous states and DC.
California Industrial Electricity Price
Rest of US
California average Industrial Price for the 12 months ended February 2024 was 19.15 cents/kWh, 152.0% higher than the US average of 7.60 cents/kWh for all states other than California. California’s industrial prices were the highest among the contiguous states and DC.
Average Price in
Other States
For the 12 months ended February 2024, California’s higher electricity prices translated into Commercial & Industrial ratepayers paying $18.9 billion more than ratepayers elsewhere in the US using the same amount of energy. Compared to the lowest rate states, Commercial & Industrial ratepayers paid $24.3 billion more.
California Natural Gas Prices
Average prices ($ per thousand cubic feet; 12-month moving average) for the 12 months ended February 2024 and changes from the previous 12-month period for each end user: