Below are the monthly updates from the most current April 2025 fuel price data (GasBuddy.com) and February 2025 electricity and natural gas price data (US Energy Information Administration). To view additional data and analysis related to the California economy visit our website at www.centerforjobs.org/ca.
Residential Natural Gas Prices Rise
In February, California average residential natural gas prices jumped from 6th to 4th highest among the contiguous states and DC. Electricity rates across all three primary end users as well as the cost of fuels remained the highest.
Inflation
For the 12 months ending February, the California CPI rose 3.0%, edging down from 3.2% for the year ending January. In the same period, the US CPI dipped to 2.8% in February from 3.0% in January. Using the same Department of Finance weighting formula, Food at Home (groceries) rose 1.6% in California compared to 1.9% for the US. Food Away from Home (restaurants and takeout) rose 5.2% compared to the US at 3.7%.
California Gasoline Taxes & Fees
Gallon of Gasoline
In March, California Energy Commission data indicates that $1.42 (31.7%) of the price of a gallon of regular gasoline was paid to cover state, local, and federal taxes and fees. The Commission, however, has not been updating their gasoline pricing data. The Gasoline Price Breakdown and Margins data containing details on taxes and environmental fees was last updated for the week of March 31. The margin analysis required under SB 1322 has not been updated since November, and contains only partial data with reports beginning last May.
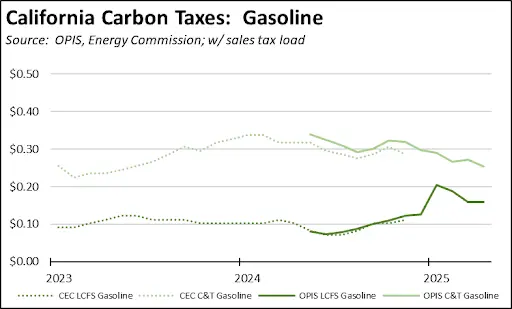
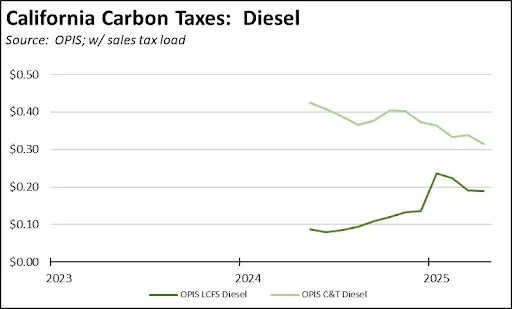
California Carbon Taxes: LCFS and Cap & Trade
This month starts the inclusion of monthly costs for the state’s two primary carbon taxes: Low Carbon Fuel Standard (LCFS) and Cap & Trade. This data is based on the Carbon Market Reports from Oil Price Information Service (OPIS). The numbers are taken from the penultimate business day month-to-date averages, and are adjusted to incorporate state and local sales taxes to reflect how they are experienced at the pump. The gasoline costs are for regular CARB gasoline. Cap & Trade incorporates both cap-at-the-rack and charges on refinery emissions. Certain Data or Information Provided By: Oil Price Information Service, LLC. Distribution of OPIS data without permission from OPIS is prohibited.
Using Energy Commission estimates to show a longer term trend for regular gasoline, LCFS costs have seen a sustained rise since last summer even before the now-pending regulation increases kick in. Cap & Trade costs have seen a slight decline in this period, but remain above the levels seen in early 2023. Note that in comparing the two data sources (both of which are adjusted for sales taxes), the Energy Commission results appear to have excluded the component of Cap & Trade imposed on the refineries, and instead just estimates the in-use charges imposed at the rack.
California vs. Rest of US Diesel Price
above Other States
(CA Average)
The April average price per gallon of diesel in California eased 3 cents from March to $5.00. The California regulatory and tax premium above the average for the US other than California ($3.47) rose to $1.53, a 44.2% difference.
In April, California had the highest diesel price among the contiguous states and DC.
Range Between Highest and Lowest Prices by Region
above Other States
(Central Coast Region)
The cost premium above the US (other than California) average price for regular gasoline ranged from $1.64 in the Inland Empire Region (average April price of $4.69), to $2.06 in Central Coast Region (average April price of $5.11).
Highest/Lowest Fuel Prices by Legislative District:
California Residential Electricity Price
Rest of US
California average Residential Price for the 12 months ended February 2025 was 31.90 cents/kWh, 104.1% higher than the US average of 15.63 cents/kWh for all states other than California. California’s residential prices were the highest among the contiguous states and DC.
California Residential Electric Bill
For the 12 months ended February 2025, the average annual Residential electricity bill in California was $1,950, or 96.2% higher ($956) than the comparable bill in 2010 (the year the AB 32 implementation began with the Early Action items). In this same period, the average US (less CA) electricity bill for all the other states grew only 26.7% ($365).
In 2010, California had the 9th lowest residential electricity bill among the contiguous states and DC. In the latest data, it had the 6th highest.
Residential bills, however, vary widely by region. Transforming the 2022 data from the Energy Commission, estimated annual household usage is as much as 82% higher in the interior regions compared to the milder climate coastal areas, and substantially higher when comparing across counties.
Rest of US
For the 12 months ended February 2025, California’s higher electricity prices translated into Residential ratepayers paying $14.1 billion more than the average ratepayers elsewhere in the US using the same amount of energy. Compared to the lowest cost state, California households paid $17.7 billion more.
California Commercial Electricity Price
Rest of US
California average Commercial Price for the 12 months ended February 2025 was 25.39 cents/kWh, 113.2% higher than the US average of 11.91 cents/kWh for all states other than California. California’s commercial prices were the highest among the contiguous states and DC.
California Industrial Electricity Price
Rest of US
California average Industrial Price for the 12 months ended February 2025 was 21.91 cents/kWh, 187.2% higher than the US average of 7.63 cents/kWh for all states other than California. California’s industrial prices were the 1th highest among the contiguous states and DC.
Rest of US
For the 12 months ended February 2025, California’s higher electricity prices translated into Commercial & Industrial ratepayers paying $21.6 billion more than ratepayers elsewhere in the US using the same amount of energy. Compared to the lowest rate states, Commercial & Industrial ratepayers paid $27.9 billion more.
California Natural Gas Prices
Average prices ($ per thousand cubic feet; 12-month moving average) for the 12 months ended February 2025 and changes from the previous 12-month period for each end user: