Below are the monthly updates from the most current April 2026 fuel price data (GasBuddy.com) and February 2026 electricity and natural gas price data (US Energy Information Administration). To view additional data and analysis related to the California economy visit our website at www.centerforjobs.org/ca.
In the latest data, California retained the highest or near the highest energy costs among the contiguous states and DC, and in some cases higher than Alaska and Hawaii as well. The industrial electricity rate returned to the highest, while the average commercial natural gas rate rose from 3rd to 2nd highest.
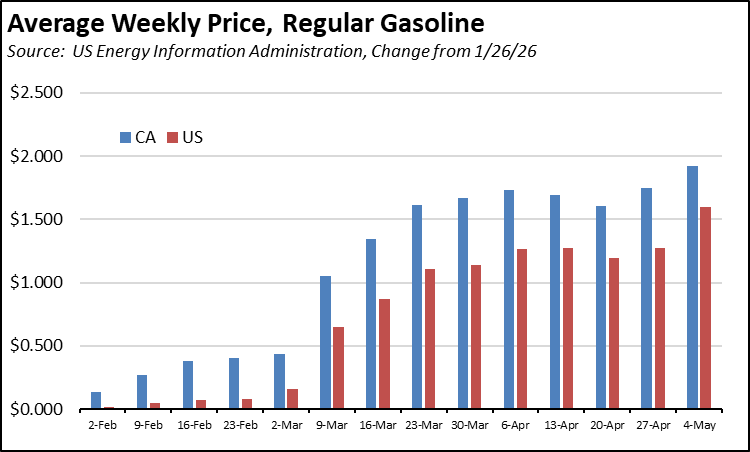
Fuel costs, however, remain a primary concern due to the currently elevated prices along with looming supply issues within California. In the latest weekly price data from US Energy Information Administration (EIA), the price rise had been stabilizing in recent weeks, but saw a new surge in the national average as the result of refinery issues in the Midwest and in the California average as the state reaches a literal end of the line for its default policy of relying on increasing imports as the backdrop for its environmental restrictions at home.
The supply issue? California contains some of the largest crude oil reserves in the country. Yet, increasing restrictions have seen production plummet 58% from the near term peak in 2015, and 78% since the overall peak in 1985. In this same period, total US production has expanded by more than 50%.
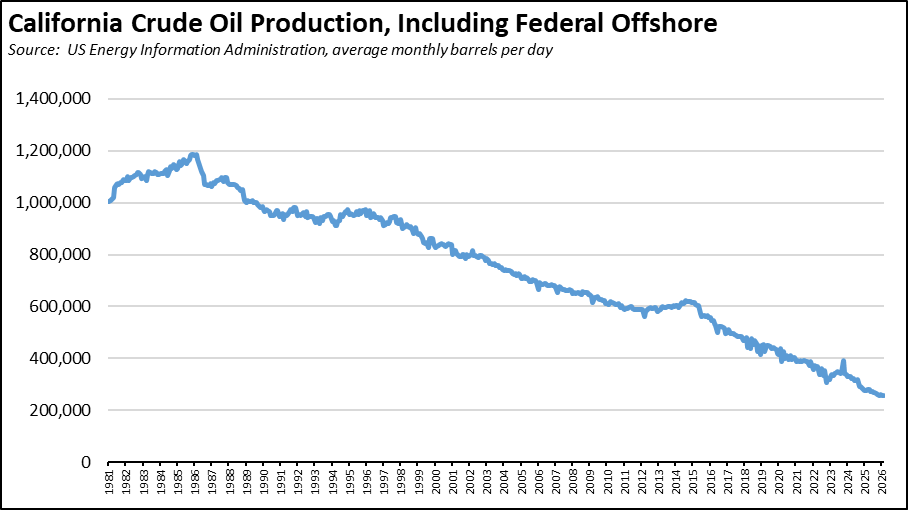
As a result, Energy Commission data shows California crude production supplied only 22.9% of what the state’s refineries used in 2025, down from 36.2% in 2015 and 61.8% in 1985. Along with declining Alaskan supplies, the shortfall instead has been made up by rising foreign imports—5.5% in 1985, 52.0% in 2015, and 61.1% in 2025. And in 2025, more than 17% of refinery crude use came from the Persian Gulf region that by and large is currently not exporting oil.
These numbers undercount California’s dependence on foreign oil. As refineries have closed in response to state regulations and policies, California has also increased its imports of blending and finished product. In 2025, EIA data shows California companies imported another 59.0 million barrels of finished fuel and blending agents, or based on yields the equivalent of another 15% on top of crude oil use by the refineries. These imports were up 74% compared to 2015 levels.
Combining the two, California in 2025 relied on imports for a full two-thirds of its fuel production, the fuel that gets people to work, students to school, goods to their points of sale, food from the fields to homes, emergency services to where they are needed, and passengers to their destinations on planes, trains, and ships. With the exception of Hawaii, the rest of the country is largely fuel independent and at least from a supply perspective is weathering the current challenges with little disruption. California in contrast has chosen to restrict access to domestic production—both physically through lack of fuel pipelines and other interstate transportation links and regulatorily through its California-only rules—under the guise of environmental protection while instead shifting and largely ignoring the environmental effects elsewhere as its need and demand for fuels have shown little change.
The potential effects of this increasing dependence is symbolically shown by the arrival in Long Beach last weekend by the last crude shipment out of the Persian Gulf since the closure of the Strait of Hormuz. But these effects are not just limited to in-state production and they are not just symbolic. Three-quarters of the state’s fuel and blendstock imports in 2025 came from Middle East and Pacific Rim countries that are also facing shortages from their usual Persian Gulf sources. These shortages are now showing up in reduced jet fuel supplies as those refineries are forced to cut back, and are likely to extend to the other fuels as well. California is now in the unenviable position of competing with its own suppliers for a currently limited key energy commodity while sitting on top of its own untapped source.
Addressing these supply issues, however, is a long-term issue. Other states such as Georgia, Indiana, Kentucky, and Utah instead are providing immediate cost relief by suspending all or a portion of their fuel taxes. By following this course of action through legislation or under the governor’s emergency powers, California could provide much greater relief than any other state based on the simple fact that it levies by far the greatest amount of taxes and fees on fuels. The following chart illustrates the potential using the April data for regular gasoline shown later in this report. The comparison shows California vs. the average for the Non-PADD V states. This comparison base puts aside Arizona and Nevada which rely on the California refineries for all or most of their fuel, Oregon and Washington which now face similar import challenges as California, and Hawaii and Alaska which represent more unique fuel situations. State taxes and fees are taken from the recent 2026 data from EIA. The local tax component is estimated by comparing the series previously maintained by the American Petroleum Institute to the EIA data for the last year that data was published. The results are shown in the chart for regular gasoline. A comparable gap exists for diesel as well.
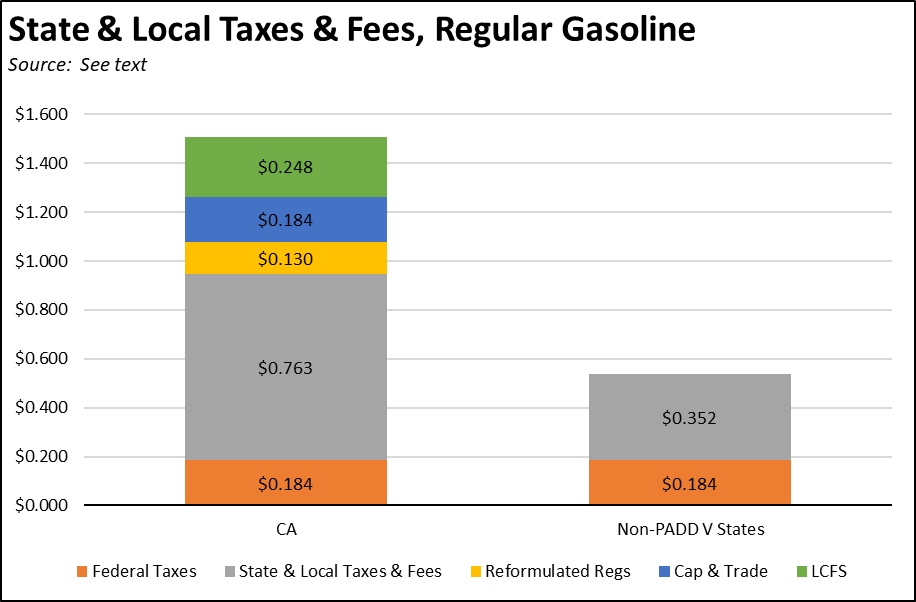
Looking at the full range of the $1.51 in taxes and fees Californians paid for every gallon of regular gasoline in April:
- The federal tax component is the same in every state.
- State and local taxes and fees are more than twice as high as the average for the other states. And not content to be at this level, the fuel excise taxes are now on course to increase even further on July 1.
- The reformulated fuel regulation component indicates the current shift from the winter to summer formulation requirements. The Energy Commission estimates the cost savings from the winter formulation—as the governor has ordered on two previous occasions to respond to past price and supply situations—saves 5 cents a gallon.
- While Oregon and Washington have recently begun imposing similar carbon taxes, California’s Cap & Trade and Low Carbon Fuel Standard (LCFS) have been in place longer, at higher levels, and are currently slated to increase significantly under amended regulations for both programs. Together, they added 43.2 cents a gallon in April.
- Combined, California’s total taxes and fees are nearly a dollar higher than the average for the other states. Putting the reformulated regulation potential savings at 5 cents, the state’s discretionary range over the current price of gasoline is $1.28 a gallon or enough to slash in half the price rise since January 26.
Inflation
For the 12 months ending February, the California CPI rose 2.9%, marginally lower than the 3.0% for the year ending December. In the same period, the US CPI was unchanged at 2.4% in both periods. Using the same Department of Finance weighting formula, Food at Home (groceries) rose 3.0% in California compared to 2.4% for the US. Food Away from Home (restaurants and takeout) rose 3.1% compared to the US at 3.9%.
California Gasoline Taxes & Fees
Gallon of Gasoline
As we have discussed in prior reports, in the absence of current Energy Commission data, we have begun our own estimates using the Commission factors and the new OPIS data. In April, $1.51 (25.4%) of the price of a gallon of regular gasoline was paid to cover state, local, and federal taxes and fees.
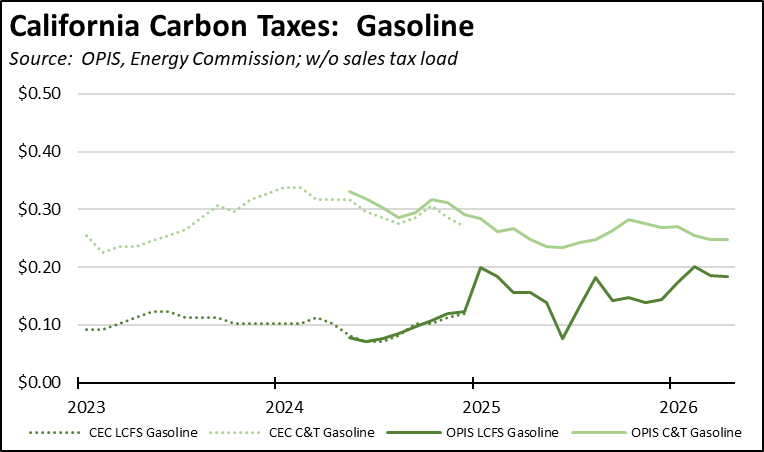
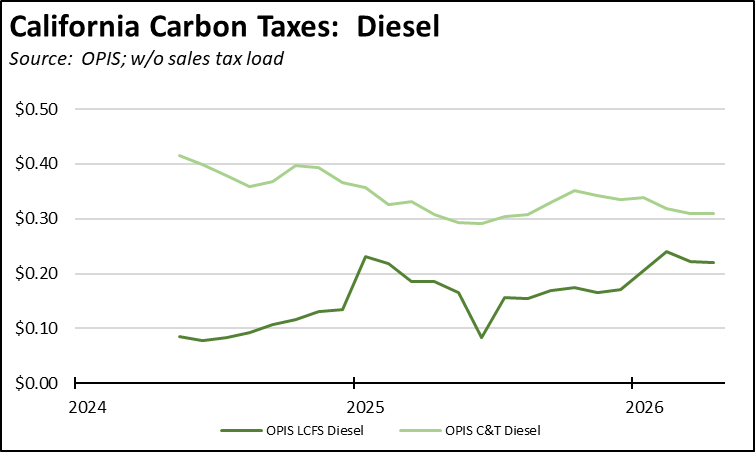
California Carbon Taxes: LCFS and Cap & Trade
In April, total LCFS charges incorporated in the price Californians pay for fuel was unchanged for gasoline but eased 1 cent for diesel, while the Cap & Trade component was unchanged for both fuels. The costs shown in the table are for the penultimate month-to-date numbers from the OPIS Carbon Market Report, adjusted to incorporate state and local sales tax to account for the full additional costs imposed by these regulatory fees on fuel buyers. Certain Data or Information Provided By: Oil Price Information Service, LLC. Distribution of OPIS data without permission from OPIS is prohibited.
Both carbon taxes have shown little change over the past 3 months. The LCFS charges are generally higher as a result of the amended regulations that went into effect last summer, while the future trend for Cap & Trade remains uncertain as CARB parses their pending regulations to this charge. Note that both charts include both the Cap & Trade components charged at the rack and levied on production from the OPIS data, and only the rack component in the Energy Commission data.
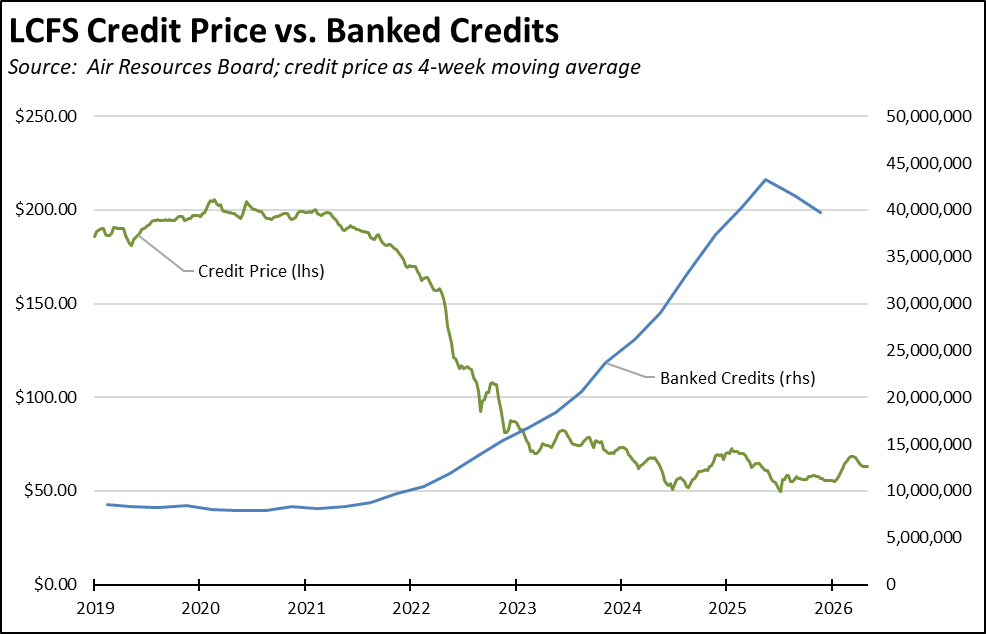
Moderation in the LCFS rise, however, stems from the substantial amount of banked credits. While the underlying credit prices have experienced a 13% rise since the beginning of the year, the much higher costs expected under the amended regulations continue to be countered by this banked buffer. The most recent 2025:Q4 report from CARB is the second in the row showing a net reduction in the banked credits. As this balance falls again to the 10-15 million range, the historical record suggests credit prices will rise much higher.
California vs. Rest of US Diesel Price
Above Other States
(CA Average)
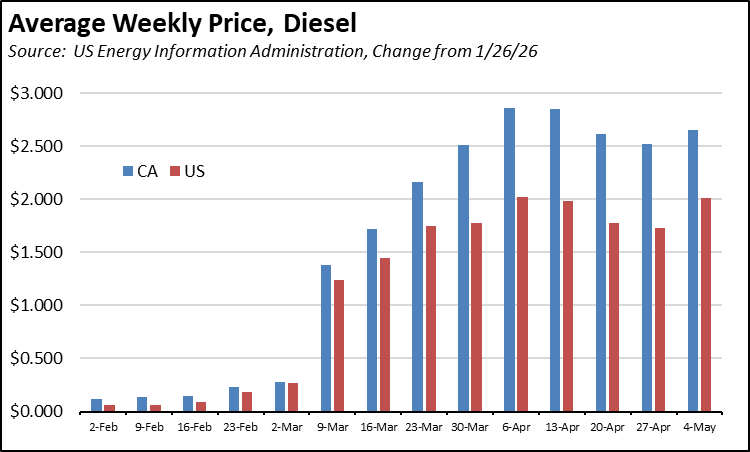
The April average price per gallon of diesel in California rose 79 cents from March to $7.57. The California regulatory and tax premium above the average for the US other than California ($5.43) rose to $2.14, a 39.5% difference.
price
In April, California had the highest diesel price among the contiguous states and DC.
Range Between Highest and Lowest Prices by Region
above Other States
(Central Coast Region)
The cost premium above the US (other than California) average price for regular gasoline ranged from $1.79 in the Central Valley Region (average April price of $5.83), to $2.02 in Central Coast Region (average April price of $6.06).
Highest/Lowest Fuel Prices by Legislative District:
California Residential Electricity Price
Rest of US
California average Residential Price for the 12 months ended February 2026 was 32.59 cents/kWh, 95.3% higher than the US average of 16.69 cents/kWh for all states other than California. California’s residential prices were the highest among the contiguous states and DC.
California Residential Electric Bill
For the 12 months ended February 2026, the average annual Residential electricity bill in California was $1,883, or 89.4% higher ($889) than the comparable bill in 2010 (the year the AB 32 implementation began with the Early Action items). In this same period, the average US (less CA) electricity bill for all the other states grew only 34.2% ($467).
In 2010, California had the 9th lowest residential electricity bill among the contiguous states and DC. In the latest data, it had the 20th highest.
Residential bills, however, vary widely by region. Transforming the 2022 data from the Energy Commission, estimated annual household usage is as much as 82% higher in the interior regions compared to the milder climate coastal areas, and substantially higher when comparing across counties.
Rest of US
For the 12 months ended February 2026, California’s higher electricity prices translated into Residential ratepayers paying $13.1 billion more than the average ratepayers elsewhere in the US using the same amount of energy, only marginally different from the premium paid in the 12 months ending January. Compared to the lowest cost state, California households paid $16.8 billion more.
California Commercial Electricity Price
Rest of US
California average Commercial Price for the 12 months ended February 2026 was 26.29 cents/kWh, 108.7% higher than the US average of 12.60 cents/kWh for all states other than California. California’s commercial prices were the highest among the contiguous states and DC.
California Industrial Electricity Price
Rest of US
California average Industrial Price for the 12 months ended February 2026 was 21.63 cents/kWh, 163.5% higher than the US average of 8.21 cents/kWh for all states other than California. California’s industrial prices were the highest among the contiguous states and DC.
Rest of US
For the 12 months ended February 2026, California’s higher electricity prices translated into Commercial & Industrial ratepayers paying $21.2 billion more than ratepayers elsewhere in the US using the same amount of energy, marginally above the premium paid during the 12 months ended January. Compared to the lowest rate state, Commercial & Industrial ratepayers paid $27.9 billion more.
California Natural Gas Prices
Average prices ($ per thousand cubic feet; 12-month moving average) for the 12 months ended February 2026 and changes from the previous 12-month period for each end user: