Below are the monthly updates from the most current August 2023 fuel price data (GasBuddy.com) and June 2023 electricity and natural gas price data (US Energy Information Administration). To view additional data and analysis related to the California economy visit our website at www.centerforjobs.org/ca.
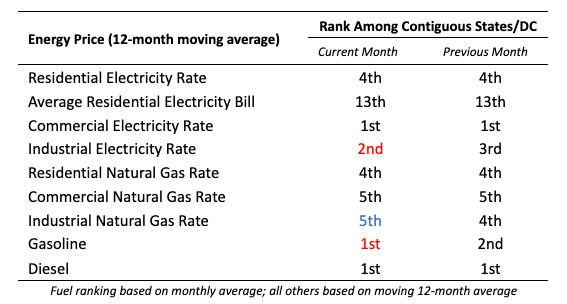
The additional costs under California policies, regulations, taxes, and fee add-ons continue their ceaseless attack on the costs of living and costs of doing business in California. Costs for energy continue to be the highest or near the highest among the contiguous states and DC across all energy sources. California regained its dubious position of having the highest gasoline prices. Industrial electricity rates moved up to the 2nd highest.
Even at these levels, gasoline prices are currently trending up in part due to production issues related to the recent hurricane activity in the Gulf of Mexico and continuing efforts by OPEC to raise crude prices. The average gasoline price in August rose 29 cents a gallon in California and somewhat slower at 19 cents in the rest of the US. In the latest data from CSAA as of September 5, prices have eased nationally by 3 cents from the August numbers, but have risen by another 10 cents in California. Prices, however, are likely to begin easing once the lower cost winter formulations come back into play.
Inflation Rate Continues to Ease but Remains High in Core Elements
For the 12 months ending June, the California CPI rose 3.1%, easing from 3.7% in May. In the same period, the US CPI rose 3.0%, down from 4.0% in May.
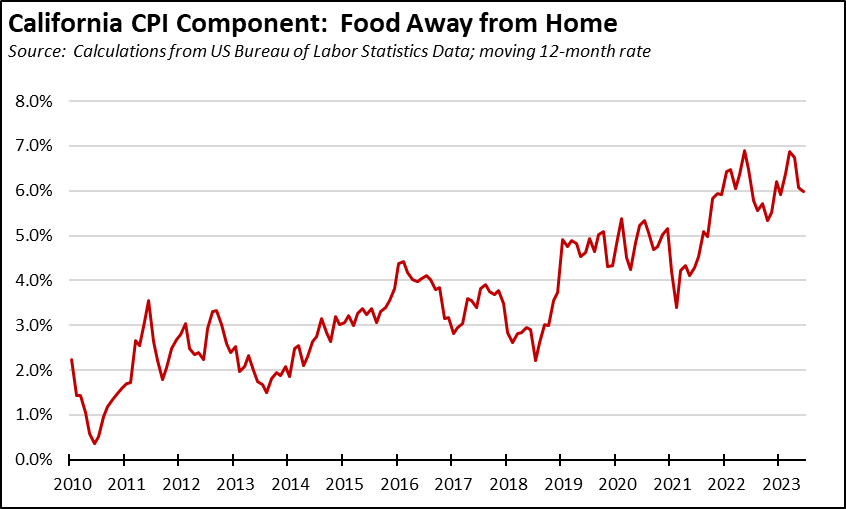
While the general inflation rate has been easing in California along with price levels nationally, individual costs of living continue to grow. Applying the Department of Finance formula used for the California CPI to the individual components, prices in Food Away from Home (restaurants and take out) continue to rise nearly twice as fast as the general inflation rate, pushed higher by increasing operating costs such as for energy and in the case of labor costs, rising costs coming from the ongoing labor shortages along with state and local policies on wages.
US Average Price
For the 12 months ended June 2023, California’s higher electricity prices translated into Residential ratepayers paying $10.7 billion more than the average ratepayers elsewhere in the US using the same amount of energy. Compared to the lowest cost state, California households paid $14.7 billion more.
California vs. Rest of US Diesel Price
Above US Average
(CA Average)
The August average price per gallon of diesel in California rose 56 cents from July to $5.74. The California premium above the average for the US other than California ($4.25) rose to $1.48, a 34.9% difference.
price
In August, California had the highest diesel price among the contiguous states and DC.
Range Between Highest and Lowest Prices by Region
The cost premium above the US (other than California) average price for regular gasoline ranged from $1.37 in the Central Valley Region (average August price of $5.10), to $1.61 in Central Sierra Region (average August price of $5.34).
Highest/Lowest Fuel Prices by Legislative District:
California Residential Electricity Price
California average Residential Price for the 12 months ended June 2023 was 27.11 cents/kWh, 79.9% higher than the US average of 15.07 cents/kWh for all states other than California. California’s residential prices were the 4th highest among the contiguous states and DC.
California Residential Electric Bill
For the 12 months ended June 2023, the average annual Residential electricity bill in California was $1,727, or 73.7% higher ($733) than the comparable bill in 2010 (the year the AB 32 implementation began with the Early Action items). In this same period, the average US (less CA) electricity bill for all the other states grew only 20.6% ($281).
In 2010, California had the 9th lowest residential electricity bill among the contiguous states and DC. In the latest data, it had the 13th highest.
Residential bills, however, vary widely by region, with the estimated annual household usage in the recent released data for 2021 as much as 78% higher in the interior regions compared to the milder climate coastal areas, and substantially higher when comparing across counties.
US Average Price
For the 12 months ended June 2023, California’s higher electricity prices translated into Residential ratepayers paying $10.7 billion more than the average ratepayers elsewhere in the US using the same amount of energy. Compared to the lowest cost state, California households paid $14.7 billion more.
California Commercial Electricity Price
California average Commercial Price for the 12 months ended June 2023 was 22.59 cents/kWh, 89.4% higher than the US average of 11.93 cents/kWh for all states other than California. California’s commercial prices were the highest among the contiguous states and DC.
California Industrial Electricity Price
California average Industrial Price for the 12 months ended June 2023 was 18.20 cents/kWh, 126.1% higher than the US average of 8.05 cents/kWh for all states other than California. California’s industrial prices rose to the 2nd highest among the contiguous states and DC.
US Average Price
For the 12 months ended June 2023, California’s higher electricity prices translated into Commercial & Industrial ratepayers paying $16.6 billion more than ratepayers elsewhere in the US using the same amount of energy. Compared to the lowest rate states, Commercial & Industrial ratepayers paid $21.3 billion more.
California Natural Gas Prices
Average prices ($ per thousand cubic feet; 12-month moving average) for the 12 months ended June 2023 and changes from the previous 12-month period for each end user: