Below are the monthly updates from the most current June 2025 fuel price data (GasBuddy.com) and June 2025 electricity and natural gas price data (US Energy Information Administration). To view additional data and analysis related to the California economy visit our website at www.centerforjobs.org/ca.
California Average Utility Bills Rise to 8 th Highest—LCFS Begins to Show in Fuel Prices
In August, California’s average annual electricity bill continued its climb to the 8 th highest among the contiguous states. While the state still enjoys a milder climate, the ability of residents and employers to
see a cost advantage has vanished in face of the ceaseless rise in the cost of energy.
Also in August, the average price for regular gasoline rose 4 cents compared to a 1 cent rise on average in the other states. California’s price increase comes close to following August’s 5 cent average increase in LCFS costs discussed below.
California: Climate Leader or Climate Cautionary Tale?
As the reality of California’s global warming emission (GHG) reductions compared to the sustained increases in overall global emissions began to hit home, justifications for the state’s programs shifted from fighting global warming to claims the state was creating models that others would adopt for this purpose. As has been the case in the recent round of self-congratulatory announcements on the state’s rising share of renewable electricity generation, claims behind this presumed leadership role carefully overlook the cost consequences to the state’s households and employers coming from these actions. Nowhere is this consequence as evident as the dramatic rise in the average electric bill—once the 9th lowest prior to the state’s climate regulations but since soaring to 8th highest in the latest data.
Taking renewable generation as an example, the data also shows California is not the leader among the states, with others achieving much higher levels without the consequent damage to households and employers in higher costs.
In terms of total renewables generation (renewables except for hydroelectric), Texas instead is by far the leading state, with more than twice as much renewable generation than California while still maintaining electricity rates that are over 60% less.
Adjusted for total system size, California in fact ranks much lower, with only 34.7% of in-state generation in 2024. Among the state leaders, only the New England states (and DC) come close to California’s rates primarily due to their artificial restraints on more cost-effective natural gas. Texas at 15th highest drops below California in this ranking, due to its high energy use as the energy supplier for many surrounding states.
The same ranking comes when looking at all non-GHG generation (renewables plus nuclear and hydroelectric), with California only the 12th highest but again with substantially higher rates.
The EIA data covers in-state generation, but California as with many other aspects of its climate policies sets standards but then relies on production and the associated impacts to occur outside its boundaries. In most years, California has relied on imports from other states to a far greater extent than any other state, but beginning in 2023 slipped to 2nd highest as electricity use soared in Virginia from the data center boom serving California’s high tech industry.
Using total system generation numbers from the Energy Commission that include imports does not affect the results substantially. The renewables share shows only a minor rise to 39.7% in 2024, as does non-GHG at 62.2%.
Inflation
For the 12 months ending June, the California CPI eased to 2.9%, dipping from 3.0% for the year ending May. In the same period, the US CPI went to 2.7% in June from 2.4% in May. Using the same Department of Finance weighting formula: the CPIs for all items less the more volatile energy component rose 3.2% in California vs. 2.9% in the US average, Food at Home (groceries) rose 2,4% in California the same as for the US, and Food Away from Home (restaurants and takeout) rose 4.5% compared to the US at 3.8%.
California Gasoline Taxes & Fees
Gallon of Gasoline
As we have discussed in prior reports, in the absence of current Energy Commission data, we have begun our own estimates using the Commission factors and the new OPIS data. In August, $1.50 (32.9%) of the price of a gallon of regular gasoline was paid to cover state, local, and federal taxes and fees.
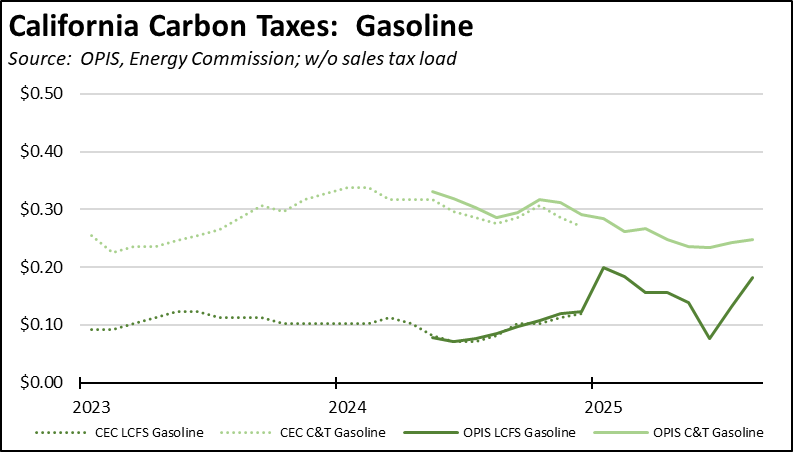
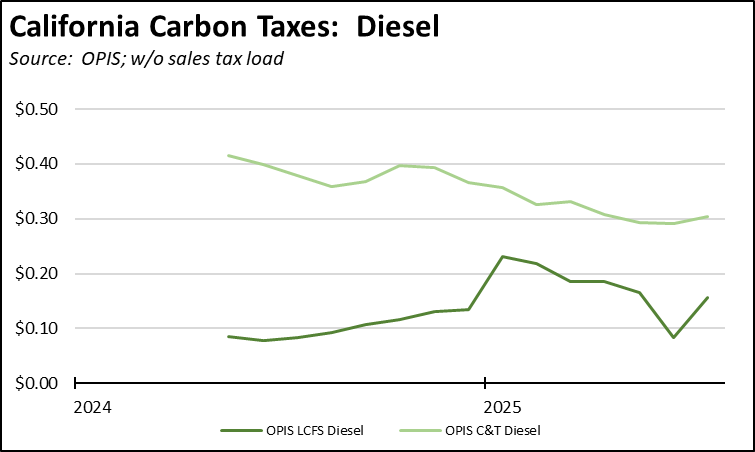
California Carbon Taxes: LCFS and Cap & Trade
In August, total LCFS charges incorporated in the price Californians pay for fuel rose 5 cents for gasoline but were unchanged for diesel, while the Cap & Trade component also showed a marginal increase for diesel. The costs shown in the table are for the penultimate month-to-date numbers from the OPIS Carbon Market Report, adjusted to incorporate state and local sales tax to account for the full additional costs imposed by these regulatory fees on fuel buyers. Certain Data or Information Provided By: Oil Price Information Service, LLC. Distribution of OPIS data without permission from OPIS is prohibited.
Combining the OPIS data (without the sales tax component) with the previous Energy Commission estimates, Cap & Trade costs are now showing a gradual rise as activity on the program’s extension has increased, while LCFS costs had been easing before June but sharply reversed course once the new regulations became effective. Note that both charts include both the Cap & Trade components charged at the rack and levied on production from the OPIS data, and only the rack component in the Energy Commission data.
The rise in LCFS costs came as prices in the underlying credit activity showed some recovery. Overall price levels, however, remain well below prior historical levels due to the large supply of banked credits. The cushion provided by this stockpile continues to delay the full cost impact of the new regulations.
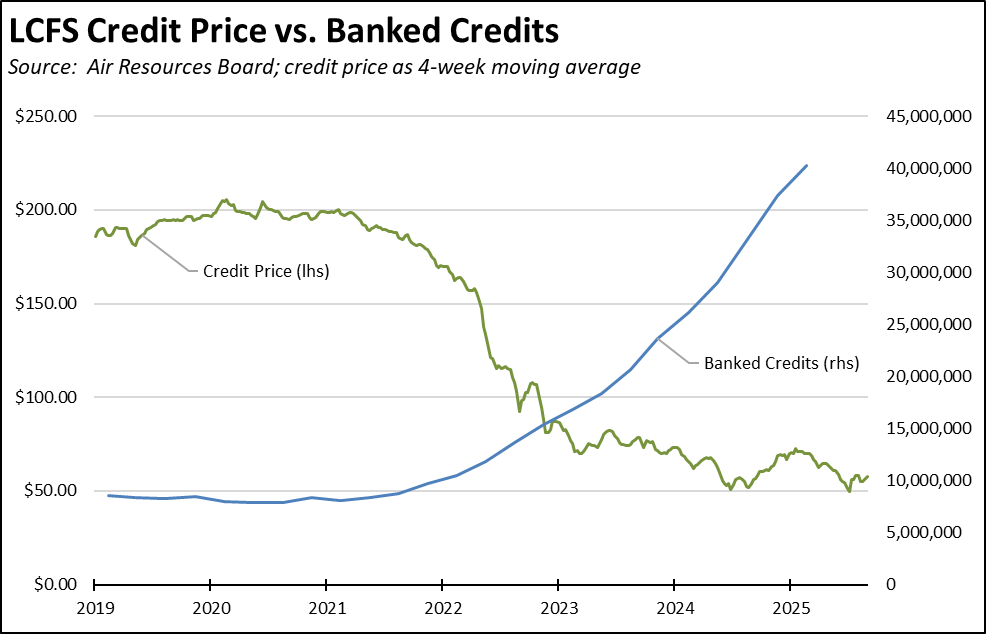
The underlying prices for the Cap and Trade components also saw some recovery in the latest auction. Following the lackluster results in May, August saw all offered allowances sold out. The settlement price rose from $25.87 in May to $28.76, the second lowest since February 2023 but still more in line with the previous easing trend seen earlier this year. Prices in the California carbon market, however, have since softened. As the program extension is resolved, prices are likely to return to previous levels, placing additional pressure on fuel prices.
California vs. Rest of US Diesel Price
Above Other States
(CA Average)
The August average price per gallon of diesel in California eased 5 cents from July to $5.13. The California regulatory and tax premium above the average for the US other than California ($3.60) eased to $1.53, a 42.6% difference.
price
In August, California had the highest diesel price among the contiguous states and DC.
Range Between Highest and Lowest Prices by Region
above Other States
(Central Sierra Region)
The cost premium above the US (other than California) average price for regular gasoline ranged from $1.35 in the Inland Empire Region (average August price of $4.41), to $1.74 in Central Sierra Region (average August price of $4.80).
Highest/Lowest Fuel Prices by Legislative District:
California Residential Electricity Price
Rest of US
California average Residential Price for the 12 months ended June 2025 was 31.83 cents/kWh, 100.4% higher than the US average of 15.88 cents/kWh for all states other than California. California’s residential prices were the highest among the contiguous states and DC.
California Residential Electric Bill
For the 12 months ended June 2025, the average annual Residential electricity bill in California was $1,949, or 96.1% higher ($955) than the comparable bill in 2010 (the year the AB 32 implementation began with the Early Action items). In this same period, the average US (less CA) electricity bill for all the other states grew only 28.6% ($391).
In 2010, California had the 9th lowest residential electricity bill among the contiguous states and DC. In the latest data, California rose to the 8th highest.
Residential bills, however, vary widely by region. Transforming the 2022 data recently released by the Energy Commission, estimated annual household usage is as much as 82% higher in the interior regions compared to the milder climate coastal areas, and substantially higher when comparing across counties.
Rest of US
For the 12 months ended June 2025, California’s higher electricity prices translated into Residential ratepayers paying $13.9 billion more than the average ratepayers elsewhere in the US using the same amount of energy. Compared to the lowest cost state, California households paid $17.7 billion more.
California Commercial Electricity Price
Rest of US
California average Commercial Price for the 12 months ended June 2025 was 25.47 cents/kWh, 110.7% higher than the US average of 12.09 cents/kWh for all states other than California. California’s commercial prices were the highest among the contiguous states and DC.
California Industrial Electricity Price
Rest of US
California average Industrial Price for the 12 months ended June 2025 was 21.76 cents/kWh, 179.3% higher than the US average of 7.79 cents/kWh for all states other than California. California’s industrial prices were the highest among the contiguous states and DC.
Rest of US
For the 12 months ended June 2025, California’s higher electricity prices translated into Commercial & Industrial ratepayers paying $21.4 billion more than ratepayers elsewhere in the US using the same amount of energy. Compared to the lowest rate states, Commercial & Industrial ratepayers paid $27.8 billion more.
California Natural Gas Prices
Average prices ($ per thousand cubic feet; 12-month moving average) for the 12 months ended June 2025 and changes from the previous 12-month period for each end user: