Below are the monthly updates from the most current December 2024 fuel price data (GasBuddy.com) and October 2024 electricity and natural gas price data (US Energy Information Administration). To view additional data and analysis related to the California economy visit our website at www.centerforjobs.org/ca.
Residential Electricity Rates Remain More than Double the Average for the Rest of the US
In October, California average natural gas rates (12-month moving average) continued to rise relative to the averages for the rest of the US. Electricity rates across all three primary end users as well as the cost of fuels remained the highest in the contiguous states.
Refinery Margins Average $0.013 per Gallone of Gasoline
Much of the recent legislation increasing regulation and consequently production costs on the state’s diminishing refinery base has been largely based on contentions related to refinery gross margins (refinery operating income less crude oil costs) as tracked by the Energy Commission tax and fee data (reported here monthly as indicated below). The new reporting as mandated by SB X1-2 (2023) provides additional details on the refinery margins, with monthly data on net margins (gross margin less operating costs) now available. The Energy Commission has defined operating costs to be those costs “incurred by the operator of a refinery in the state to produce gasoline meeting California specifications, including, but not limited to, costs of labor, electricity, natural gas, chemicals, maintenance, hydrogen, and other intermediate oil products, federal renewable identification numbers, obligation costs, capital investments, logistics costs, and additive costs.”
Net operating margin consequently captures the portion of gasoline and diesel prices flowing as income (as an industry) from refinery operations. It is not the same as profit. Profit instead is calculated as the summation of net operating income from all company operations less additional company-wide cost components including selling, general and administrative expenses, exploration expenses, depreciation, depletion and amortization, interest and debt costs, and taxes.
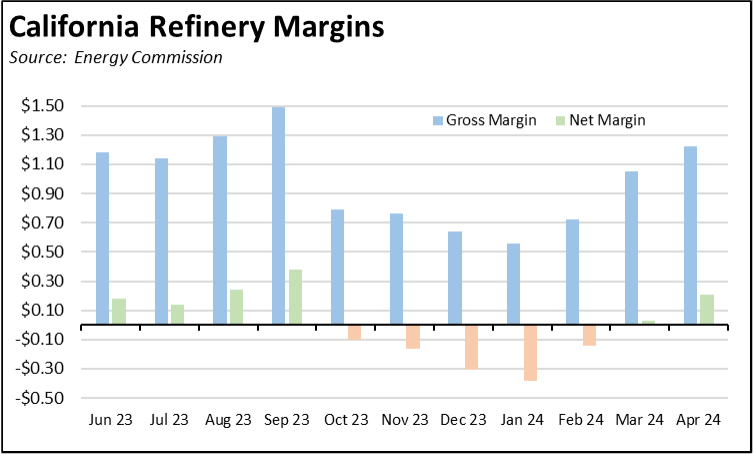
Combining the 11 months for which the net margin data is available, the state’s refineries in this period generated net operating income of only $0.013 per gallon of gasoline sold, or an effective rate of 0.4% on the wholesale price and, using the GasBuddy.com data, 0.3% on the average retail price.
The low level of the net margin also has implications to future gasoline costs from the recently renewed regulatory additions. In response to the backlash generated from the likely price impact of the recently approved LCFS (low carbon fuel standard) amendments, Air Resources Board staff have attempted to backtrack from their previous assumptions that 100% of LCFS and Cap and Trade costs are likely to be passed onto the customer. Yet, the low net margins shown in the Energy Commission data indicate that any new costs imposed on refinery operations are more than likely to be passed through. The current roster of these new price impacts includes the following additional mandates on the refinery operations:
- Compliance costs of SB X1-2, although relatively minor in the context of this list.
- Unknown costs of the yet-to-be-determined compliance requirements for new storage mandates under AB X2-1 (2024)
- Higher LCFS costs under the Air Board’s recently adopted amendments.
- Higher Cap and Trade costs under pending changes being considered by the Air Board, including increased required for refinery operations and for use of the fuel allocated at the wholesale point of sale.
At the other end of the cost scale, however, is the continued rise in the amount of taxes and fees imposed on Californians as they buy fuels. In the latest Energy Commission data, total federal, state, and local taxes and fees total $1.38 or a third (33.4%) of the cost of each gallon of gasoline. This amount will see a jump this month as the revised LCFS requirements take effect.
Inflation
2023
For the 12 months ending October, the California CPI rose 2.5%, the same as through September. In the same period, the US CPI went to 2.6% in October from 2.4% in September.
California Gasoline Taxes & Fees
Gallon of Gasoline
In December, California Energy Commission data indicates that $1.38 (33.4%) of the price of a gallon of regular gasoline was paid to cover state, local, and federal taxes and fees.
California vs. Rest of US Diesel Price
(CA Average)
The December average price per gallon of diesel in California eased 6 cents from November to $4.82. The California regulatory and tax premium above the average for the US other than California ($3.41) eased to $1.41, a 41.4% difference.
price
In December, California had the highest diesel price among the contiguous states and DC.
Range Between Highest and Lowest Prices by Region
above Other States
(Central Coast Region)
The cost premium above the US (other than California) average price for regular gasoline ranged from $1.28 in the Central Valley Region (average December price of $4.21), to $1.66 in Central Coast Region (average December price of $4.59).
Highest/Lowest Fuel Prices by Legislative District:
California Residential Electricity Price
Rest of US
California average Residential Price for the 12 months ended October 2024 was 31.48 cents/kWh, 103.9% higher than the US average of 15.44 cents/kWh for all states other than California. California’s residential prices were the highest among the contiguous states and DC.
California Residential Electric Bill
For the 12 months ended October 2024, the average annual Residential electricity bill in California was $1,914, or 92.6% higher ($920) than the comparable bill in 2010 (the year the AB 32 implementation began with the Early Action items). In this same period, the average US (less CA) electricity bill for all the other states grew only 25.6% ($350).
In 2010, California had the 9th lowest residential electricity bill among the contiguous states and DC. In the latest data, it had the 8th highest.
Residential bills, however, vary widely by region. Transforming the 2022 data from the Energy Commission, estimated annual household usage is as much as 82% higher in the interior regions compared to the milder climate coastal areas, and substantially higher when comparing across counties.
Rest of US
For the 12 months ended October 2024, California’s higher electricity prices translated into Residential ratepayers paying $13.8 billion more than the average ratepayers elsewhere in the US using the same amount of energy. Compared to the lowest cost state, California households paid $17.3 billion more.
California Commercial Electricity Price
Rest of US
California average Commercial Price for the 12 months ended October 2024 was 25.64 cents/kWh, 116.4% higher than the US average of 11.85 cents/kWh for all states other than California. California’s commercial prices were the highest among the contiguous states and DC.
California Industrial Electricity Price
Rest of US
California average Industrial Price for the 12 months ended October 2024 was 21.53 cents/kWh, 182.9% higher than the US average of 7.61 cents/kWh for all states other than California. California’s industrial prices were the highest among the contiguous states and DC.
Rest of US
For the 12 months ended October 2024, California’s higher electricity prices translated into Commercial & Industrial ratepayers paying $21.8 billion more than ratepayers elsewhere in the US using the same amount of energy. Compared to the lowest rate states, Commercial & Industrial ratepayers paid $27.8 billion more.
California Natural Gas Prices
Average prices ($ per thousand cubic feet; 12-month moving average) for the 12 months ended October 2024 and changes from the previous 12-month period for each end user: