Below are the monthly updates from the most current February 2022 fuel price data (GasBuddy.com) and December 2021 electricity and natural gas price data (US Energy Information Administration).
The release of the December 2021 utility rate data provides a moment to assess the effect of the state’s energy policies on the ceaseless rise in the California costs of living. Based on the preliminary data, growth in the average 2021 electricity rates accelerated, ranging from 6.0% for industrial rates, to 11.7% for residential rates. Natural gas costs soared even higher, ranging from 17.5% for residential, to 28.8% for industrial. Overall inflation in this period as estimated by the California CPI grew by 6.5%.
Change in Average Rate, 2021
Source: US Energy Information Administration
California fuel costs—affecting households directly as they buy gasoline and diesel for their vehicles and indirectly as the costs of moving goods rise even higher during a period of continuing supply chain disruptions—reached their highest point ever in the latest average data from February. Prices have since continued to soar as a result of oil market volatility arising from the Russian invasion of Ukraine. In the latest CSAA data from March 6, the average California price for gasoline reached $5.29 a gallon and for diesel, $5.60—again, by far the highest in the nation. By county, gasoline prices ranged from $5.01 in Kings County to $5.47 in Napa and $5.96 in Mono County.
While current uncertainty in the oil markets is affecting fuel prices in every state, California regulations and policies make the state’s households more vulnerable to this spiking cost of living element. In addition to the cost pressures coming from world oil prices, these California-only factors now add a gasoline cost premium running at about $1.30 a gallon higher than the average for all the other states, and $1.57 compared to the lowest cost state in the latest February data.
These price spikes are also coming during the period when the state’s refineries are engaged in the mandated shift to the summer formulation requirements. As has happened in the past, any disruptions during that process quickly translate into supply shortages due to the state’s regulatory isolation from the national and global markets. While the governor’s January budget proposed some cost relief by foregoing the scheduled July increase in the state fuel taxes, the amount involved is only a fraction of the rising costs households and businesses now face due to current global pressures and the ongoing cost premium self-imposed by the California-only factors.
California also remains more vulnerable than the other states to any turmoil in the oil export markets. Based on Energy Commission data, California’s reliance on oil imports has gone from 25.7% in 2000 to 56.2% in 2021. Alaskan oil—which previously provided a degree of stability in both sources and prices due to the ability of the receiving refineries to run fewer slates—went from 24.9% to 14.9% in this period. As state actions continue to limit California production—along with comparable federal actions limiting potential Alaskan production levels as well—the immediate effects, as indicated in the chart below, are a continued rise in the state’s vulnerability to imports and import disruptions. The proposed outcome of the state policies—a shift from fossil fuels to “clean” sources—may be possible in the long run if those policies turn out to be effective. The effect in the immediate and interim terms, however, is to add to the supply shortages currently having a major effect on the costs of living.
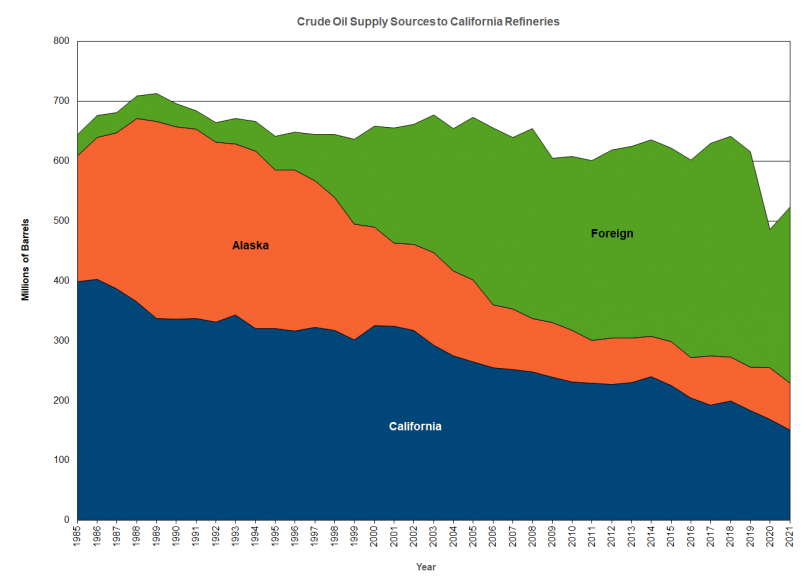
Source: California Energy Commission
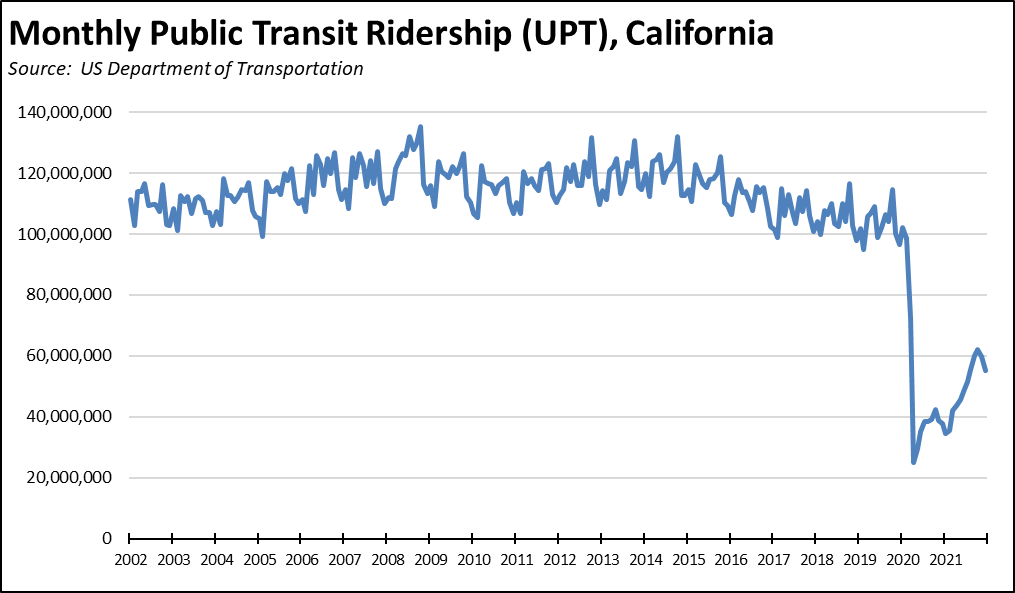
State policies in recent years have been based on the contention that as the cost of traditional fuels is forced to rise through regulations and cutbacks in domestic production, Californians instead will shift to public transit and other alternative transportation modes such as walking and bicycling. The most recent transportation tax increases in SB 1 (2017) allocated to capacity expansion focus almost exclusively on these modes.
Californians, however, have not responded to these policies as expected. Even prior to the pandemic, public transit ridership was on a sustained decline. As measured by UPT (unlinked passenger trips), transit ridership in California in 2019 was 14% below the post-Great Recession high in 2014, and 16% lower than its all-time high in 2008. Ridership recovered somewhat in 2021, but in its peak month, only managed to reach 60% of the pre-pandemic 2019 average.
The combination of these effects has placed the greatest burden on the lower wage workers in the state. Higher wage workers were largely protected from the employment impacts from the state-ordered shutdowns as many employers shifted quickly to telework and other operational shifts. These workers also have been largely protected from rising fuel costs in this period as well because they no longer had to do a physical commute. At these income levels, they also retained the option to purchase a higher-priced electric vehicle, although as discussed in another of our recent reports, the operating cost incentive to do so is being undermined by the rising electricity costs in the state.
Lower wage and many middle wage workers with jobs that are not amenable to telework—either due to the nature of the job or due to restrictions built into state laws—have instead borne the brunt of these rising prices. With public transit not an option for many of these workers, their living standards—despite strong wage growth in the current period—continue to be battered by state policies.
Inflation Rising
California CPI
For the 12 months ending December, the California CPI rose 6.5%, up from 6.0% in November. In the same period, the US CPI rose 7.0%, increasing to 7.5% in January. The US December inflation rate is the highest since June 1982. The California December inflation rate is the highest since November 1990.
California vs. US Diesel Price
Above US Average
(CA Average)
The February average price per gallon of diesel in California rose 21 cents from January to $5.05. The California premium above the average for the US other than California ($3.91) eased to $1.15, a 29.4% difference. The February average price for gasoline was the highest in our tracking series, which begins in 2000.
In February, California again had the highest diesel price among the states and DC for the sixth month in a row.
Range Between Highest and Lowest Prices by Region
Above US Average
(Central Sierra Region)
The cost premium above the US (other than California) average price for regular gasoline ranged from $1.16 in the Central Valley Region (average February price of $4.64), to $1.41 in Central Sierra Region (average February price of $4.89).
Highest/Lowest Fuel Prices By Legislative District:
The estimates below cover the 2012 district boundaries. This data along with the other subject areas will be adjusted this year to the recently approved 2022 districts.
California Residential Electricity Price
Rest Of US
California average Residential Price for the 12 months ended December 2021 was 22.84 cents/kWh, 75.2% higher than the US average of 13.04 cents/kWh for all states other than California. California’s residential prices were again the highest among the contiguous states.
California Residential Electric Bill
For the 12 months ended December 2021, the average annual Residential electricity bill in California was $1,496, or 50.5% higher ($502) than the comparable bill in 2010 (the year the AB 32 implementation began with the Early Action items). In this same period, the average US (less CA) electricity bill for all the other states grew only 8.4% ($114).
In 2010, California had the 9th lowest residential electricity bill in the nation. In the latest data, it had the 23rd highest.
Residential bills, however, vary widely by region, with the estimated annual household usage in the recent released data for 2020 as much as 78% higher in the interior regions compared to the milder climate coastal areas, and substantially higher when comparing across counties.
US Average Price
For the 12 months ended December 2021, California’s higher electricity prices translated into Residential ratepayers paying $8.9 billion more than the average ratepayers elsewhere in the US using the same amount of energy.
California Commercial Electricity Price
Rest Of US
California average Commercial Price for the 12 months ended December 2021 was 19.21 cents/kWh, 83.0% higher than the US average of 10.50 cents/kWh for all states other than California. California’s commercial prices were again the highest among the contiguous states.
California Industrial Electricity Price
Rest Of US
California average Industrial Price for the 12 months ended December 2021 was 15.13 cents/kWh, 121.8% higher than the US average of 6.82 cents/kWh for all states other than California. California’s industrial prices were the 3rd highest among the contiguous states.
US Average Price
For the 12 months ended December 2021, California’s higher electricity prices translated into Commercial & Industrial ratepayers paying $13.3 billion more than ratepayers elsewhere in the US using the same amount of energy. Compared to the lowest rate states, Commercial & Industrial ratepayers paid $16.8 billion more.
California Natural Gas Prices
Average prices ($ per thousand cubic feet) for the 12 months ended December 2021 and changes from the previous 12-month period for each end user: