Below are the monthly updates from the most current January 2019 fuel price data (GasBuddy.com) and November 2018 electricity and natural gas price data (US Energy Information Agency). To view additional data and analysis related to the California economy visit our website at www.centerforjobs.org/ca.
California vs. US Diesel Price
Above US Average
(CA Average)
The January average price per gallon of diesel in California eased 10 cents from December to $3.78. As prices eased lower in the rest of the US, the California premium above the average for the US other than California ($2.87) rose to 91.1 cents, a 31.7% difference.
In January, California had the 2nd highest diesel price among the states and DC, behind only Hawaii.
Range Between Highest and Lowest Prices by Region
Above US Average
(Central Coast Region)
The cost premium above the US (other than California) average price for regular gasoline ranged from $0.96 in the Sacramento Region (average January price of $3.13), to $1.20 in Central Coast Region (average January price of $3.37).
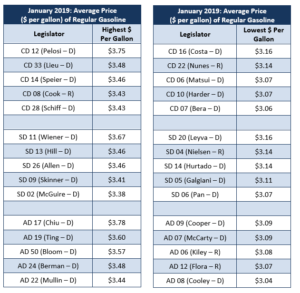
Highest/Lowest Fuel Prices by Legislative District:
California Residential Electricity Price
Rest of US
California average Residential Price for the 12 months ended November 2018 was 18.90 cents/kWh, 51.2% higher than the US average of 12.50 cents/kWh for all states other than California. California’s residential prices remained the 7th highest in the nation.
California Residential Electric Bill
For the 12 months ended November 2018, the average annual Residential electricity bill in California was $1,228, or 23.5% higher ($234) than the comparable bill in 2010 (the year the AB 32 implementation began with the Early Action items). In this same period, the average US (less CA) electricity bill for all the other states grew only 4.8% ($65).
Residential bills, however, vary widely by region, with the estimated annual household usage in 2017 as much as 55% higher in the interior regions compared to the milder climate coastal areas.
Impact on Residential Ratepayers
US Average Price
For the 12 months ended November 2018, California’s higher electricity prices translated into Residential ratepayers paying $5.7 billion more than the average ratepayers elsewhere in the US using the same amount of energy.
California Commercial Electricity Price
Rest Of US
California average Commercial Price for the 12 months ended November 2018 was 16.39 cents/kWh, 61.8% higher than the US average of 10.13 cents/kWh for all states other than California. California’s commercial prices remained the 5th highest in the nation.
California Industrial Electricity Price
Rest Of US
California average Industrial Price for the 12 months ended November 2018 was 13.31 cents/kWh, 102.3% higher than the US average of 6.58 cents/kWh for all states other than California. California’s industrial prices remained the 6th highest in the nation.
Impact On Commercial And Industrial Ratepayers
US Average Price
For the 12 months ended November 2018, California’s higher electricity prices translated into Commercial & Industrial ratepayers paying $10.4 billion more than ratepayers elsewhere in the US using the same amount of energy.
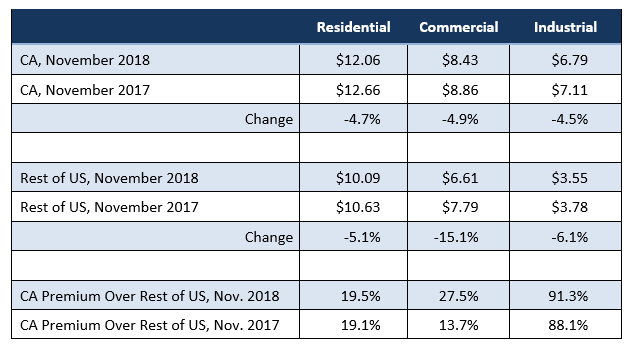
California Natural Gas Prices
Average prices ($ per thousand cubic feet) for the 12 months ended November 2018 and changes from the previous 12-month period for each end user: