Below are the monthly updates from the most current January 2022 fuel price data (GasBuddy.com) and November 2021 electricity and natural gas price data (US Energy Information Administration).
The results continue to reflect elevated oil and gas prices, as demand fueled by the recovery has outpaced the restoration of supplies affected by pandemic shutdowns and by a continuing series of restrictions at both the state and federal levels. While the January averages show the price gap for fuels between California and the other states eased by a few cents as global prices drove prices in other states up as well, California regulations since have affected in-state prices more heavily as refineries begin to shift to the summer blend requirements. Prices overall in the most recent postings show gasoline breaking previous records in different parts of the state.
November electricity rates saw little change from the prior month, with California regulations keeping residential and commercial rates at the highest and industrial rates at the second highest among the contiguous states. Natural gas rates moved up, with residential rates going from 7th to 4th highest among the contiguous states, commercial rates going from 9th to 8th, and industrial rates remaining at the 4th highest. Both electricity and natural gas rates are based on 12-month moving averages.
Nationally and within the state, rising energy prices over the past year have contributed heavily to the recent spikes in inflation. While supply shortages due to ongoing supply chain disruption and labor shortages have also been leading contributors, rising energy costs have fueled inflation directly through the amounts consumers pay for utilities and transportation fuels and indirectly as these energy components affect production, transportation, and sales costs for both goods and services.
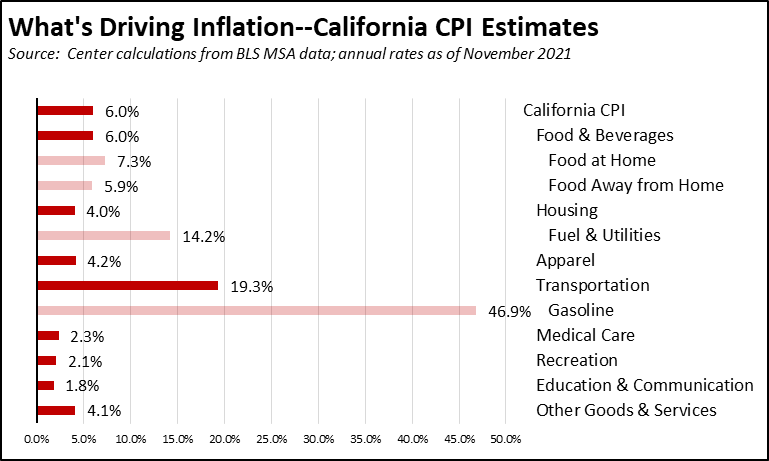
These effects can be illustrated by breaking the CPI down into its components. Applying the same formula used by Department of Finance to come up with the weighted average for the California CPI to its components results in the estimates in the chart below. Direct household energy purchases consist of the Fuel & Utilities portion of Housing, which rose 14.2% over the 12 months ending November 2021, and the Gasoline portion of Transportation, which rose 46.9%. Of the core components, Food & Beverages is the only other one currently outpacing the general inflationary rise in the state.
As calculated through the Finance weighting formula, the California CPI is rising at rates just slightly below the national inflation numbers. This outcome, however, has to be considered from the fact that the state’s inflationary trends are being applied to a much higher cost base, overall and in particular when looking at the energy numbers. In the most recent Regional Price Parity data from US Bureau of Economic Analysis for 2020, California was the 3rd most expensive state behind only Hawaii and New Jersey. At the MSA level, California contained half of the 10 most expensive urban areas in the country, and 12 of the 20 most expensive.
From a policy perspective, a great deal of consideration has been given to how California can pursue a more equitable recovery. The actions, however, have only looked at certain elements while allowing energy costs to be driven to new levels, not just higher than in previous years but higher than virtually any other state. Actions have focused on rents, not the related utility costs required to live within those households. Actions have focused on working conditions, not the rising cost of workers getting to their jobs especially with mass transit becoming less of an option than it was even prior to the pandemic.
Historically, energy cost spikes of the magnitude being imposed on California have typically led to recessions. Costs rise rapidly and thereby squeeze household budgets that must then be cut back to pay the more essential energy bills, leading to reduced sales and jobs in other parts of the economy.
Lower income households throughout the state have already experienced this effect, although the scale of the cost impacts is beginning to affect other income levels as well. In the most recent Household Pulse Survey from the US Census Bureau:
- 19.4% of the state’s population age 18 and over was in a household that was unable to pay a utility bill or pay the full amount in at least one or two of the prior twelve months, and 4.8% were unable to do so almost every month. For household incomes of less than $50,000, the rates rose to 40.0% and 10.6%, respectively. For household incomes of less than $25,000, the rates were 47.9% and 14.7%.
- Even cutting back on energy use has done little to help. In total, 19.2% were in households that kept the temperature at a level that felt unsafe or unhealthy at least one or two months, and 6.0% did so almost every month. For household income less than $50,000, the rates were 34.5% and 11.1%. For household incomes of less than $25,000, the rates were 34.8% and 10.7%.
- Cutting back on other basic costs of living has been more prevalent. In total, 25.7% were in households reducing spending on other necessities such as medicine or food in order to pay their utility bill at least one or two months, and 7.0% did so almost every month. For household incomes under $50,000, the rates jump to 49.8% and 15.4%. For household incomes under $25,000, the rates are 55.3% and 16.2%.
The survey results are for the period December 29, 2021, through January 10, 2022.
Inflation Rising
in California CPI
For the 12 months ending November, the California CPI rose 6.0%, up from 5.6% in November. In the same period, the US CPI rose 6.8%, increasing to 7.0% in December. The US November rate is the highest since June 1982. The California November rate is the highest since January 1991.
California vs. US Diesel Price
Above US Average
(CA Average)
The January average price per gallon of diesel in California rose 3 cents from December to $4.84. The California premium above the average for the US other than California ($3.58) eased to $1.27, a 35.4% difference.
In January, California again had the highest diesel price among the states and DC.
Range Between Highest and Lowest Prices by Region
Above US Average
(Central Sierra Region)
The cost premium above the US (other than California) average price for regular gasoline ranged from $1.29 in the Central Valley Region (average January price of $4.53), to $1.54 in Central Sierra Region (average January price of $4.78).
Highest/Lowest Fuel Prices By Legislative District:
The estimates below cover the 2012 district boundaries. This data along with the other subject areas will be adjusted this year to the recently approved 2022 districts.
California Residential Electricity Price
Rest Of US
California average Residential Price for the 12 months ended November 2021 was 22.58 cents/kWh, 72.9% higher than the US average of 13.06 cents/kWh for all states other than California. California’s residential prices again were the highest among the contiguous states.
California Residential Electric Bill
For the 12 months ended November 2021, the average annual Residential electricity bill in California was $1,496, or 50.5% higher ($502) than the comparable bill in 2010 (the year the AB 32 implementation began with the Early Action items). In this same period, the average US (less CA) electricity bill for all the other states grew only 7.8% ($106).
In 2010, California had the 9th lowest residential electricity bill in the nation. In the latest data, it again had the 23rd highest.
Residential bills, however, vary widely by region, with the estimated annual household usage in the recent released data for 2020 as much as 78% higher in the interior regions compared to the milder climate coastal areas, and substantially higher when comparing across counties.
US Average Price
For the 12 months ended November 2021, California’s higher electricity prices translated into Residential ratepayers paying $8.7 billion more than the average ratepayers elsewhere in the US using the same amount of energy.
California Commercial Electricity Price
Rest Of US
California average Commercial Price for the 12 months ended November 2021 was 19.00 cents/kWh, 80.4% higher than the US average of 10.53 cents/kWh for all states other than California. California’s commercial prices were the highest of the contiguous states.
California Industrial Electricity Price
Rest Of US
California average Industrial Price for the 12 months ended November 2021 was 15.05 cents/kWh, 120.7% higher than the US average of 6.82 cents/kWh for all states other than California. Among the contiguous states, only Rhode Island had a higher industrial rate.
US Average Price
For the 12 months ended November 2021, California’s higher electricity prices translated into Commercial & Industrial ratepayers paying $13.0 billion more than ratepayers elsewhere in the US using the same amount of energy. Compared to the lowest rate states, Commercial & Industrial ratepayers paid $16.7 billion more.
California Natural Gas Prices
Average prices ($ per thousand cubic feet) for the 12 months ended November 2021 and changes from the previous 12-month period for each end user are shown below. Among the contiguous states, California’s residential and industrial rates were the 4th highest, and the commercial rate was the 8th highest.