Below are the monthly updates from the most current January 2025 fuel price data (GasBuddy.com) and November 2024 electricity and natural gas price data (US Energy Information Administration). To view additional data and analysis related to the California economy visit our website at www.centerforjobs.org/ca.
Residential Electricity Rates More than Double the Average for the Rest of the US
In November, California average residential electricity rates (12-month moving average) again were more than double the average for the rest of the US. Electricity rates across all three primary end users as well as the cost of fuels remained the highest in the contiguous states and DC.
Inflation
2023
For the 12 months ending November 2024, the California CPI rose 2.6%, edging up from 2.5% for the year ending October. In the same period, the US CPI went to 2.7% in November from 2.6% in October.
California Gasoline Taxes & Fees
Gallon of Gasoline
In January, California Energy Commission data indicates that $1.41 (33.8%) of the price of a gallon of regular gasoline was paid to cover state, local, and federal taxes and fees.
California vs. Rest of US Diesel Price
Above Other States
(CA Average)
The January average price per gallon of diesel in California rose 14 cents from December to $4.96. The California regulatory and tax premium above the average for the US other than California ($3.53) rose to $1.43, a 40.5% difference.
price
In January, California had the highest diesel price among the contiguous states and DC.
Range Between Highest and Lowest Prices by Region
above Other States
(Central Coast Region)
The cost premium above the US (other than California) average price for regular gasoline ranged from $1.30 in the Central Valley Region (average January price of $4.30), to $1.64 in Central Coast Region (average January price of $4.64).
Highest/Lowest Fuel Prices by Legislative District:
California Residential Electricity Price
Rest of US
California average Residential Price for the 12 months ended November 2024 was 31.71 cents/kWh, 104.6% higher than the US average of 15.50 cents/kWh for all states other than California. California’s residential prices were the highest among the contiguous states and DC.
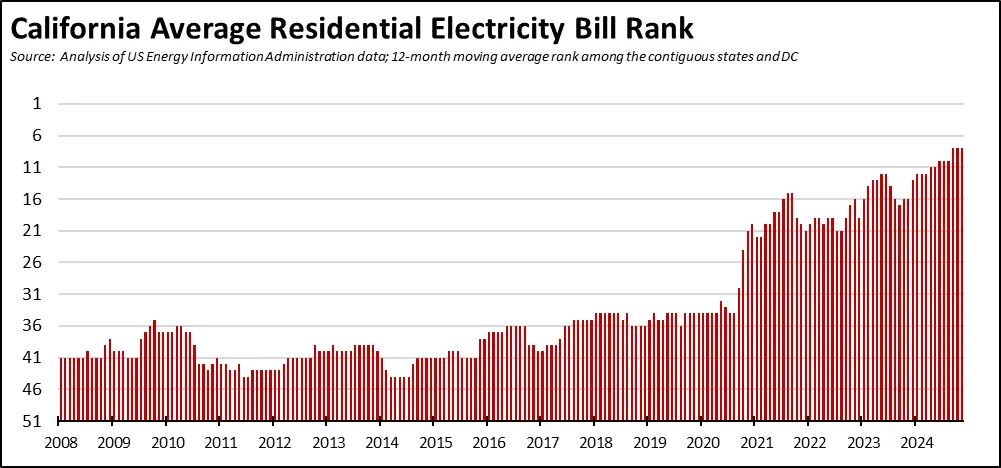
California Residential Electric Bill
For the 12 months ended November 2024, the average annual Residential electricity bill in California was $1,921, or 93.3% higher ($927) than the comparable bill in 2010 (the year the AB 32 implementation began with the Early Action items). In this same period, the average US (less CA) electricity bill for all the other states grew only 24.8% ($339).
In 2010, California had the 9th lowest residential electricity bill among the contiguous states and DC. In the latest data, it had the 8th highest. California’s average bill has been as low as 6th lowest in 2014, but the relative standing began deteriorating sharply at the end of 2020.
Residential bills, however, vary widely by region. Transforming the 2022 data from the Energy Commission, estimated annual household usage is as much as 82% higher in the interior regions compared to the milder climate coastal areas, and substantially higher when comparing across counties.
Rest of US
For the 12 months ended November 2024, California’s higher electricity prices translated into Residential ratepayers paying $13.9 billion more than the average ratepayers elsewhere in the US using the same amount of energy. Compared to the lowest cost state, California households paid $17.4 billion more.
California Commercial Electricity Price
Rest of US
California average Commercial Price for the 12 months ended November 2024 was 25.26 cents/kWh, 113.0% higher than the US average of 11.86 cents/kWh for all states other than California. California’s commercial prices were the highest among the contiguous states and DC.
California Industrial Electricity Price
Rest of US
California average Industrial Price for the 12 months ended November 2024 was 21.60 cents/kWh, 184.2% higher than the US average of 7.60 cents/kWh for all states other than California. California’s industrial prices were the highest among the contiguous states and DC.
Rest of US
For the 12 months ended November 2024, California’s higher electricity prices translated into Commercial & Industrial ratepayers paying $21.4 billion more than ratepayers elsewhere in the US using the same amount of energy. Compared to the lowest rate states, Commercial & Industrial ratepayers paid $27.5 billion more.
California Natural Gas Prices
Average prices ($ per thousand cubic feet; 12-month moving average) for the 12 months ended November 2024 and changes from the previous 12-month period for each end user: