Below are the monthly updates from the most current July 2023 fuel price data (GasBuddy.com) and May 2023 electricity and natural gas price data (US Energy Information Administration). To view additional data and analysis related to the California economy visit our website at www.centerforjobs.org/ca.
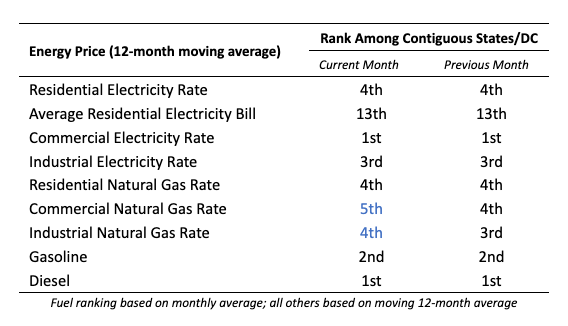
The additional costs under California policies, regulations, taxes, and fee add-ons continue to keep prices at the highest or near the highest among the contiguous states and DC across all energy sources.
As the result of heat-related refinery issues and rising world oil prices, gasoline prices are currently trending up across the nation. The average gasoline price in July edged up 6 cents in California and marginally higher at 8 cents in the rest of the US. In the latest data from CSAA as of August 7, prices have risen nationally by 19 cents and by 14 cents in California. The price increases, however, have begun to slow in part due to easing demand.
Inflation Rate Eases
For the 12 months ending May, the California CPI rose 3.7%, easing from 4.2% in April. In the same period, the US CPI rose 4.0%, down from 4.9% in April.
California vs. Rest of US Diesel Price
Above US Average
(CA Average)
The July average price per gallon of diesel in California rose 13 cents from June to $5.18. The California premium above the average for the US other than California ($3.84) rose to $1.34, a 34.8% difference.
price
In July, California had the highest diesel price among the contiguous states and DC.
Range Between Highest and Lowest Prices by Region
The cost premium above the US (other than California) average price for regular gasoline ranged from $1.28 in the Central Valley Region (average July price of $4.82), to $1.53 in Central Sierra Region (average July price of $5.07).
Highest/Lowest Fuel Prices by Legislative District:
California Residential Electricity Price
California average Residential Price for the 12 months ended May 2023 was 26.99 cents/kWh, 79.8% higher than the US average of 15.01 cents/kWh for all states other than California. California’s residential prices were the 4th highest among the contiguous states and DC.
California Residential Electric Bill
For the 12 months ended May 2023, the average annual Residential electricity bill in California was $1,752, or 76.3% higher ($758) than the comparable bill in 2010 (the year the AB 32 implementation began with the Early Action items). In this same period, the average US (less CA) electricity bill for all the other states grew only 21.4% ($292).
In 2010, California had the 9th lowest residential electricity bill among the contiguous states and DC. In the latest data, it had the 13th highest.
Residential bills, however, vary widely by region, with the estimated annual household usage in the recent released data for 2021 as much as 78% higher in the interior regions compared to the milder climate coastal areas, and substantially higher when comparing across counties.
US Average Price
For the 12 months ended May 2023, California’s higher electricity prices translated into Residential ratepayers paying $10.8 billion more than the average ratepayers elsewhere in the US using the same amount of energy. Compared to the lowest cost state, California households paid $14.9 billion more.
California Commercial Electricity Price
California average Commercial Price for the 12 months ended May 2023 was 22.44 cents/kWh, 87.6% higher than the US average of 11.96 cents/kWh for all states other than California. California’s commercial prices were the highest among the contiguous states and DC.
California Industrial Electricity Price
California average Industrial Price for the 12 months ended May 2023 was 18.07 cents/kWh, 122.8% higher than the US average of 8.11 cents/kWh for all states other than California. California’s industrial prices were the 3rd highest among the contiguous states and DC.
US Average Price
For the 12 months ended May 2023, California’s higher electricity prices translated into Commercial & Industrial ratepayers paying $16.4 billion more than ratepayers elsewhere in the US using the same amount of energy. Compared to the lowest rate states, Commercial & Industrial ratepayers paid $21.2 billion more.
California Natural Gas Prices
Average prices ($ per thousand cubic feet; 12-month moving average) for the 12 months ended May 2023 and changes from the previous 12-month period for each end user: