
Below are the monthly updates from the most current July 2026 fuel price data (GasBuddy.com) and May 2026 electricity and natural gas price data (US Energy Information Administration). To view additional data and analysis related to the California economy visit our website at www.centerforjobs.org/ca.
California energy prices remained the highest or near the highest among the contiguous states and DC, although there was nominal improvement in the rankings for average residential electricity bill and industrial natural gas prices.
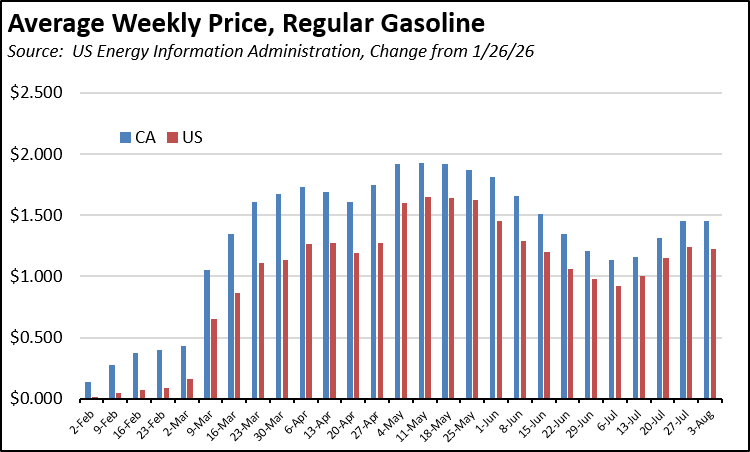
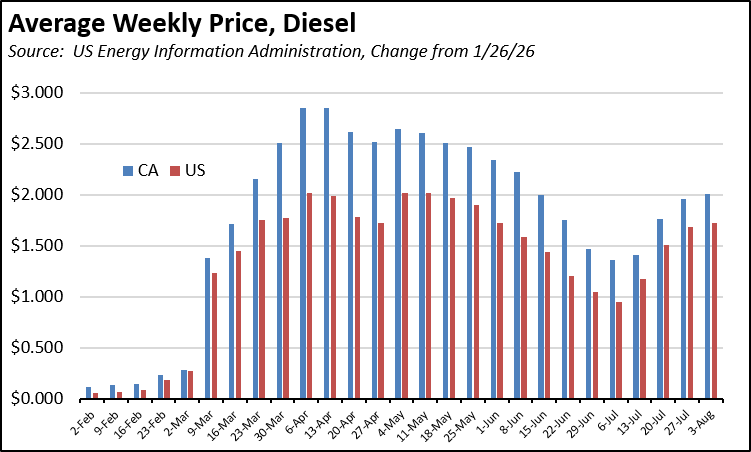
Regular gasoline was largely unchanged, easing 1.6% in the July average, while diesel also showed little change, dipping by 1.5%. Prices in the other states and DC similarly showed little change, up 0.8% and 1.7% respectively.
Prices in the weekly averages continued to show only minor shifts, with the gasoline spread between California and the US largely stable since the end of June and the diesel spread largely stable over the past 3 weeks.
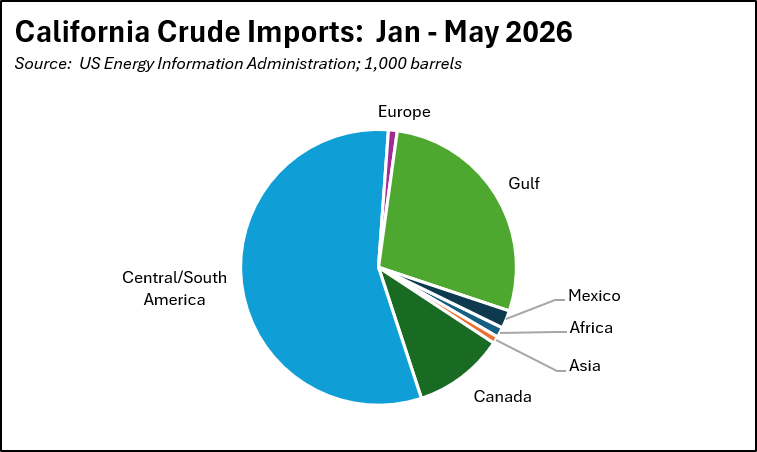
Reflecting the state’s declining refinery capacity, crude imports from other countries are down over the past 5 months (-15.0%) compared to the same period in 2025, while product imports are up more substantially (42.5%).
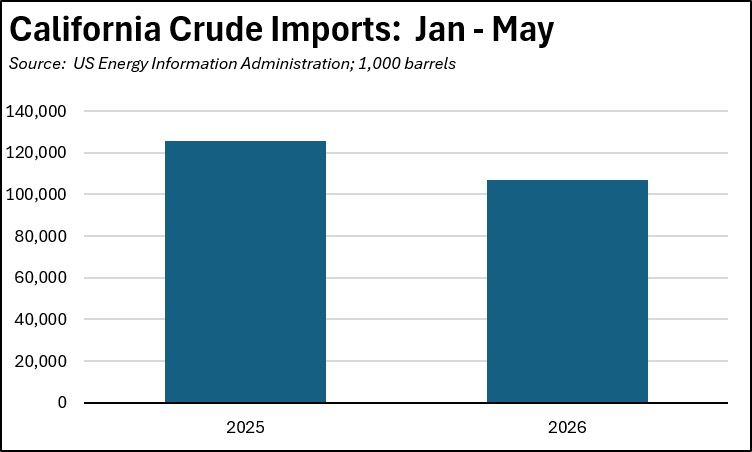
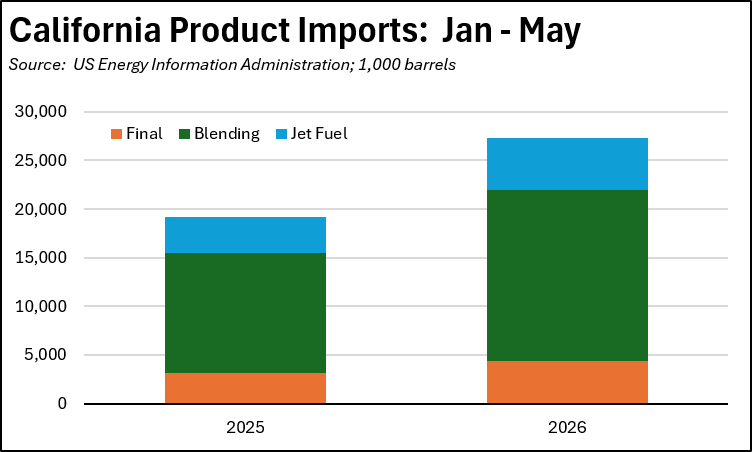
With the source distribution little changed from the same period in 2025, Central/South America accounts for just over half of the state’s crude imports, while Persian Gulf nations and Persian Gulf risks apply to just over a quarter.
At the other end of the supply line, just under 2/3 of products come from Asian sources, which in turn are dependent on Gulf crude sources.
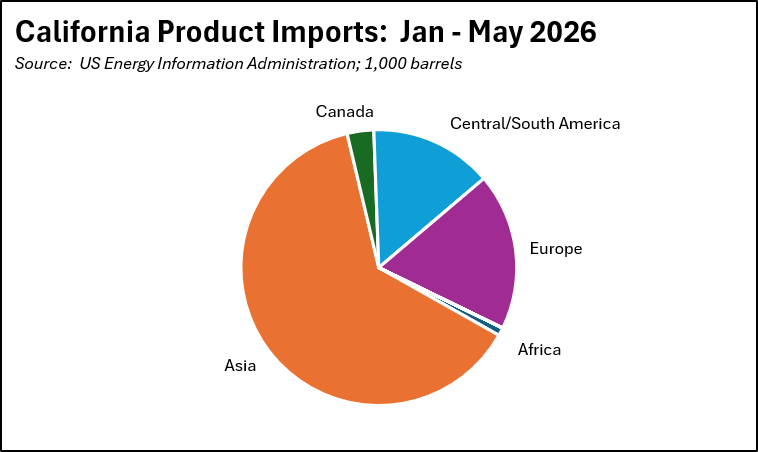
In all cases, the graphs above cover imports from other countries and do not include crude from Alaska. Energy Commission data shows California relied on foreign imports for 61.1% of its crude supplies in 2025, and Alaska for 16.0%.
Inflation
For the 12 months ending May, the California CPI rose 3.6%, the same as in April. In the same period, the US CPI went to 4.2% in May from 3.8% in April. Using the same Department of Finance weighting formula, Food at Home (groceries) rose 3.6% in California compared to 2.7% for the US. Food Away from Home (restaurants and takeout) rose 2.5% compared to the US at 3.5%.
California Gasoline Taxes & Fees
Gallon of Gasoline
As discussed in prior reports, we have begun developing our own estimates using the new OPIS data and the cost difference factors summarized in a recent post from the Energy Institute at Haas.
In July, $1.61 (29.1%) of the price of a gallon of regular gasoline was paid to cover state, local, and federal taxes and fees.
California Carbon Taxes: LCFS and Cap & Trade
In July, the combined carbon taxes rose 2 cents a gallon for regular gasoline and 7 cents for diesel. The costs shown in the table are for the penultimate month-to-date numbers from the OPIS Carbon Market Report, adjusted to incorporate state and local sales tax to account for the full additional costs imposed by these regulatory fees on fuel buyers. Certain Data or Information Provided By: Oil Price Information Service, LLC. Distribution of OPIS data without permission from OPIS is prohibited.
Combining the OPIS data (without the sales tax component) with the previous Energy Commission estimates, both carbon taxes are now on an upward trend as prices for the underlying credits continue to rise. Note that both charts include both the Cap & Trade (Invest) components charged at the rack and levied on production from the OPIS data, and only the rack component in the Energy Commission data.
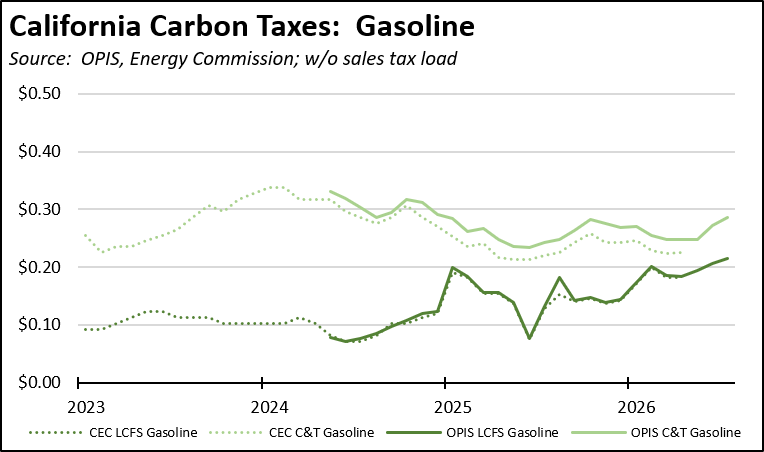
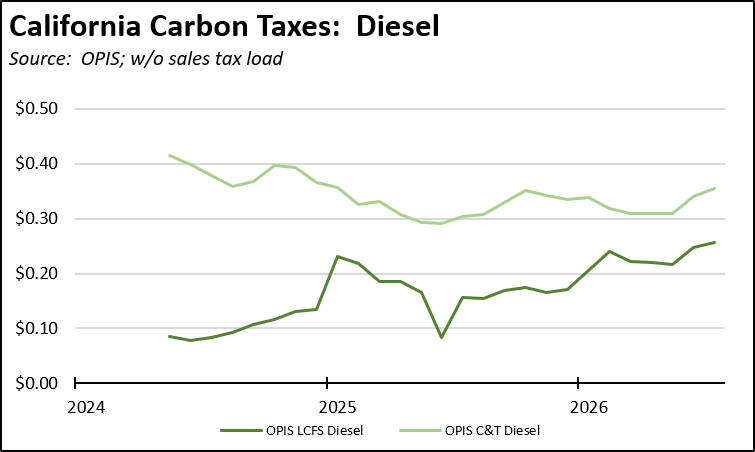
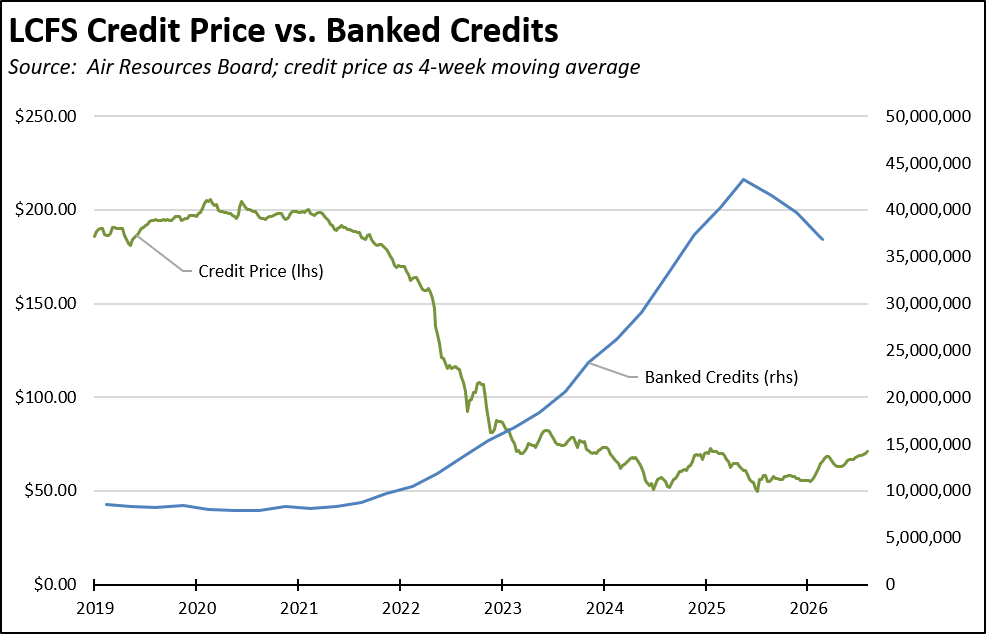
California carbon allowances are up 19.9% compared to a year ago, while LCFS credit prices are on a rise as the banked credit amount begins to decline. On a 4-week moving average, LCFS credit prices are up 42.8% compared to their recent low in June 2025. The most recent accounting from the Air Resources Board shows banked credits again dropping, by 7.1% in the first quarter and a total decline of 14.8% since the peak in the 3rd quarter of 2025. As we have discussed in previous reports, the accelerated rise in LCFS cost impacts on fuels forecast by several analysts at the time of the previous rulemaking are likely to start occurring once the credit bank reaches levels previously seen in 2022. The recent numbers, however, suggest that point may come sooner than even our base case estimates.
California vs. Rest of US Diesel Price
Above Other States
(CA Average)
The July average price per gallon of diesel in California eased 10 cents from June to $6.71. The California regulatory and tax premium above the average for the US other than California ($5.01) eased to $1.71, a 34.1% difference.
price
In July, California had the highest diesel price among the contiguous states and DC.
Range Between Highest and Lowest Prices by Region
above Other States
(Central Sierra Region)
The cost premium above the US (other than California) average price for regular gasoline ranged from $1.56 in the Inland Empire Region (average July price of $5.44), to $1.91 in Central Sierra Region (average July price of $5.79).
Highest/Lowest Fuel Prices by Legislative District:
California Residential Electricity Price
Rest of US
California average Residential Price for the 12 months ended May 2026 was 32.77 cents/kWh, 93.3% higher than the US average of 16.95 cents/kWh for all states other than California. California’s residential prices were the highest among the contiguous states and DC.
California Residential Electric Bill
For the 12 months ended May 2026, the average annual Residential electricity bill in California was $1,919, or 93.1% higher ($925) than the comparable bill in 2010 (the year the AB 32 implementation began with the Early Action items). In this same period, the average US (less CA) electricity bill for all the other states grew only 36.0% ($492). In 2010, California had the 9th lowest residential electricity bill among the contiguous states and DC. In the latest data, it had the 20th highest.
Residential bills, however, vary widely by region. Transforming the 2024 data recently released by the Energy Commission, estimated annual household usage is as much as 80% higher in the interior regions compared to the milder climate coastal areas, and substantially higher when comparing across counties.
Rest of US
For the 12 months ended May 2026, California’s higher electricity prices translated into Residential ratepayers paying $13.2 billion more than the average ratepayers elsewhere in the US using the same amount of energy. Compared to the lowest cost state, California households paid $17.1 billion more.
California Commercial Electricity Price
Rest of US
California average Commercial Price for the 12 months ended May 2026 was 26.84 cents/kWh, 111.0% higher than the US average of 12.72 cents/kWh for all states other than California. California’s commercial prices were the highest among the contiguous states and DC.
California Industrial Electricity Price
Rest of US
California average Industrial Price for the 12 months ended May 2026 was 21.77 cents/kWh, 162.3% higher than the US average of 8.30 cents/kWh for all states other than California. California’s industrial prices were the highest among the contiguous states and DC.
Rest of US
For the 12 months ended May 2026, California’s higher electricity prices translated into Commercial & Industrial ratepayers paying $21.5 billion more than ratepayers elsewhere in the US using the same amount of energy. Compared to the lowest rate state, Commercial & Industrial ratepayers paid $28.4 billion more.
California Natural Gas Prices
Average prices ($ per thousand cubic feet; 12-month moving average) for the 12 months ended May 2026 and changes from the previous 12-month period for each end user: