Below are the monthly updates from the most current June 2023 fuel price data (GasBuddy.com) and April 2023 electricity and natural gas price data (US Energy Information Administration). To view additional data and analysis related to the California economy visit our website at www.centerforjobs.org/ca.
The additional costs under California policies, regulations, taxes, and fee add-ons continue to keep prices at the highest or near the highest among the contiguous states and DC across all energy sources.

The average gasoline price in June marginally reversed the previous easing, edging up 4 cents in California and 2 cents in the rest of the US. In the latest data from CSAA as of July 5, prices dipped nationally by 4 cents and by 2 cents in California.
The June results also show Washington prices moving ahead for the first time in our series, with an average price 3 cents higher than California. The shift in that state’s prices are associated with supply issues stemming from maintenance on one of its major refineries and a key product pipeline, similar to supply shortages that have over time led to spikes in California’s prices. Other price pressures have come from the recent introduction of Washington’s carbon pricing system. The comparative ranking, however, is likely to be temporary, with California gas taxes quickly working to close the difference. As of July 1, the California gas tax rose 4.0 cents and the diesel tax by 3.1 cents.
The current climate policy debates began over what was then termed the hockey-stick graph, developed in a 1998 paper that attempted to reconstruct global temperatures and show a sharp rise attributable to human activities over the prior century.
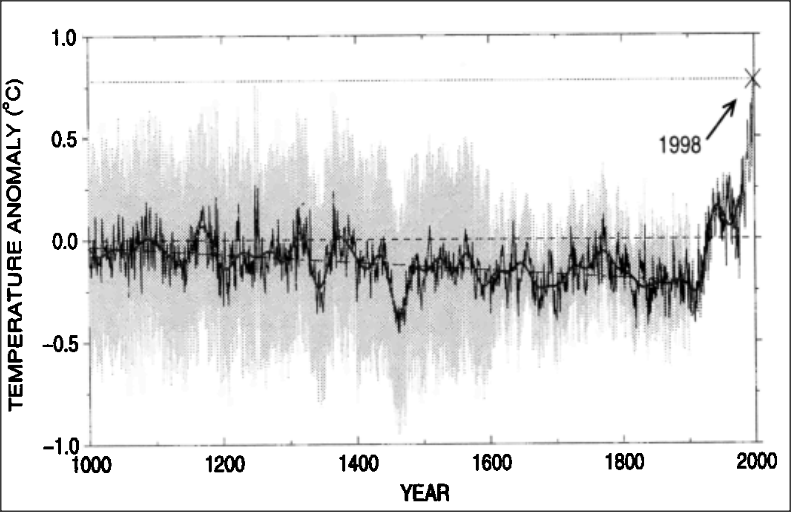
Source: Mann, Bradely & Hughes, 1998
While that data has since been subject to considerable debate and revision, California’s early forays into climate change policies were largely based on this graph. And in the process, the way California has chosen to pursue those policies has produced its own version of the hockey stick graph, only this time the state-generated version illustrates the sharply rising costs being imposed on residents and employers. Looking at the residential electricity rates, the average (12-month moving average) grew annually at 3.4% through the 3rd quarter of 2020, but then spiked to an annual rate of 12.6% in the period after.
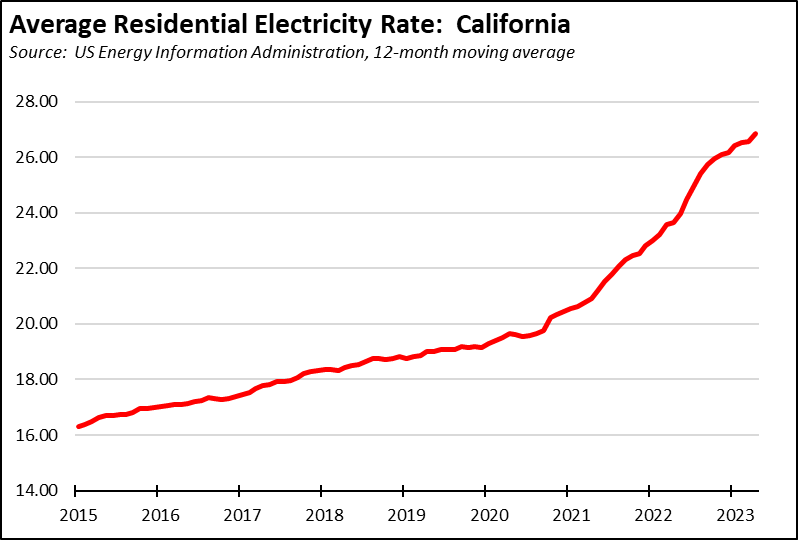
The results are similar for commercial and industrial rates and for end user rates for natural gas as well. In all just looking at these six cost graphs, California’s policies have produced enough hockey sticks to equip the number of team players allowed on the ice during the normal course of play.
Inflation Rate Unchanged
For the 12 months ending April, the California CPI rose 4.2%, continuing at the same rate as in March. In the same period, the US CPI rose 4.9%, marginally down from 5.0% in March.
California vs. US Diesel Price
Above US Average
(CA Average)
The June average price per gallon of diesel in California eased 9 cents from May to $5.05. Even with this easing, the California premium above the average for the US other than California ($3.80) rose to $1.25, a 32.9% difference.
price
In June, California had the highest diesel price among the contiguous states and DC.
Range Between Highest and Lowest Prices by Region
The cost premium above the US (other than California) average price for regular gasoline ranged from $1.30 in the Sacramento Region (average June price of $4.77), to $1.56 in Central Sierra Region (average June price of $5.03).
Highest/Lowest Fuel Prices by Legislative District:
California Residential Electricity Price
California average Residential Price for the 12 months ended April 2023 was 26.85 cents/kWh, 79.8% higher than the US average of 14.93 cents/kWh for all states other than California. California’s residential prices were the 4th highest among the contiguous states and DC.
California Residential Electric Bill
For the 12 months ended April 2023, the average annual Residential electricity bill in California was $1,758, or 76.9% higher ($764) than the comparable bill in 2010 (the year the AB 32 implementation began with the Early Action items). In this same period, the average US (less CA) electricity bill for all the other states grew only 21.6% ($295).
In 2010, California had the 9th lowest residential electricity bill among the contiguous states and DC. In the latest data, it had the 13th highest.
Residential bills, however, vary widely by region, with the estimated annual household usage in the recent released data for 2021 as much as 78% higher in the interior regions compared to the milder climate coastal areas, and substantially higher when comparing across counties.
US Average Price
For the 12 months ended April 2023, California’s higher electricity prices translated into Residential ratepayers paying $10.9 billion more than the average ratepayers elsewhere in the US using the same amount of energy. Compared to the lowest cost state, California households paid $14.9 billion more.
California Commercial Electricity Price
California average Commercial Price for the 12 months ended April 2023 was 22.28 cents/kWh, 86.3% higher than the US average of 11.96 cents/kWh for all states other than California. California’s commercial prices were the highest among the contiguous states and DC.
California Industrial Electricity Price
California average Industrial Price for the 12 months ended April 2023 was 17.92 cents/kWh, 119.3% higher than the US average of 8.17 cents/kWh for all states other than California. California’s industrial prices were the 3rd highest among the contiguous states and DC.
US Average Price
For the 12 months ended April 2023, California’s higher electricity prices translated into Commercial & Industrial ratepayers paying $16.1 billion more than ratepayers elsewhere in the US using the same amount of energy. Compared to the lowest rate states, Commercial & Industrial ratepayers paid $21.0 billion more.
California Natural Gas Prices
Average prices ($ per thousand cubic feet; 12-month moving average) for the 12 months ended April 2023 and changes from the previous 12-month period for each end user: