Below are the monthly updates from the most current March 2025 fuel price data (GasBuddy.com) and January 2025 electricity and natural gas price data (US Energy Information Administration). To view additional data and analysis related to the California economy visit our website at www.centerforjobs.org/ca.
Residential Electricity Rates Now More than Double the Average for the Rest of the US
In January, the California average residential electricity bill (12-month moving average) kept moving up into 6th place among the contiguous states and DC, putting us just barely behind Texas. Electricity rates across all three primary end users as well as the cost of fuels remained the highest in the contiguous states and DC.
As we hurtle towards Tax Day for most of California, it’s again time to reflect on the fact that personal income tax is only one of the many ways state actions add to California’s highest-in-the-nation cost of living. Tax Day comes once a year (or 4 times if you pay estimated taxes), but state (and local) regulatory taxes and fees hit household budgets on a more regular basis. State average electricity prices remain by far the highest among the contiguous states and DC.
Residential rates have grown so high and so fast that the average residential electricity bill rose from the 9th lowest in 2010 at the beginning of the current climate change program, to the 6th highest in the most recent data.
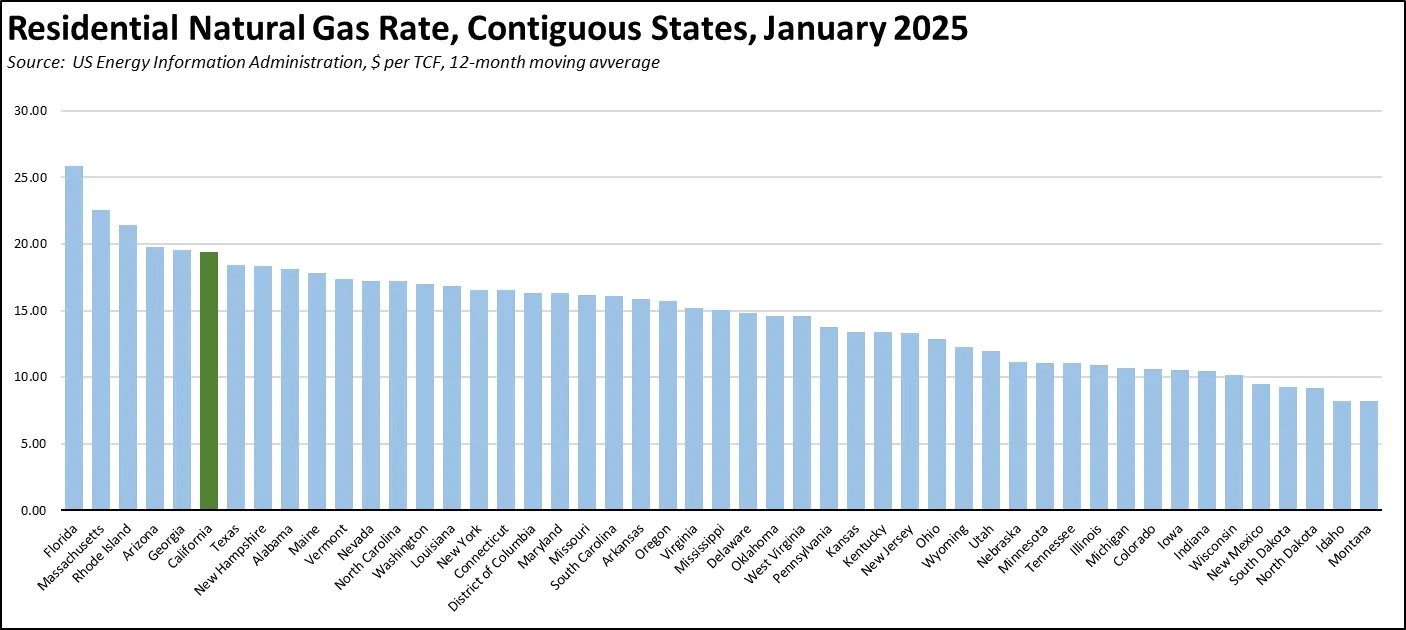
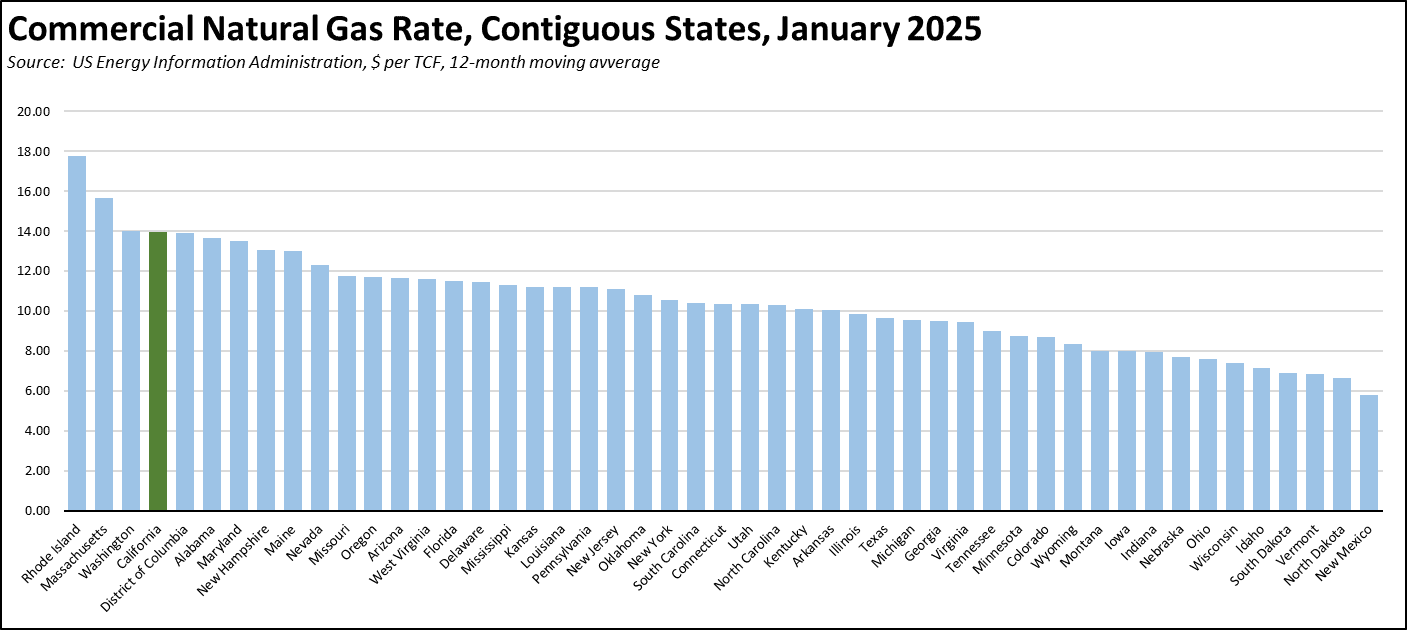
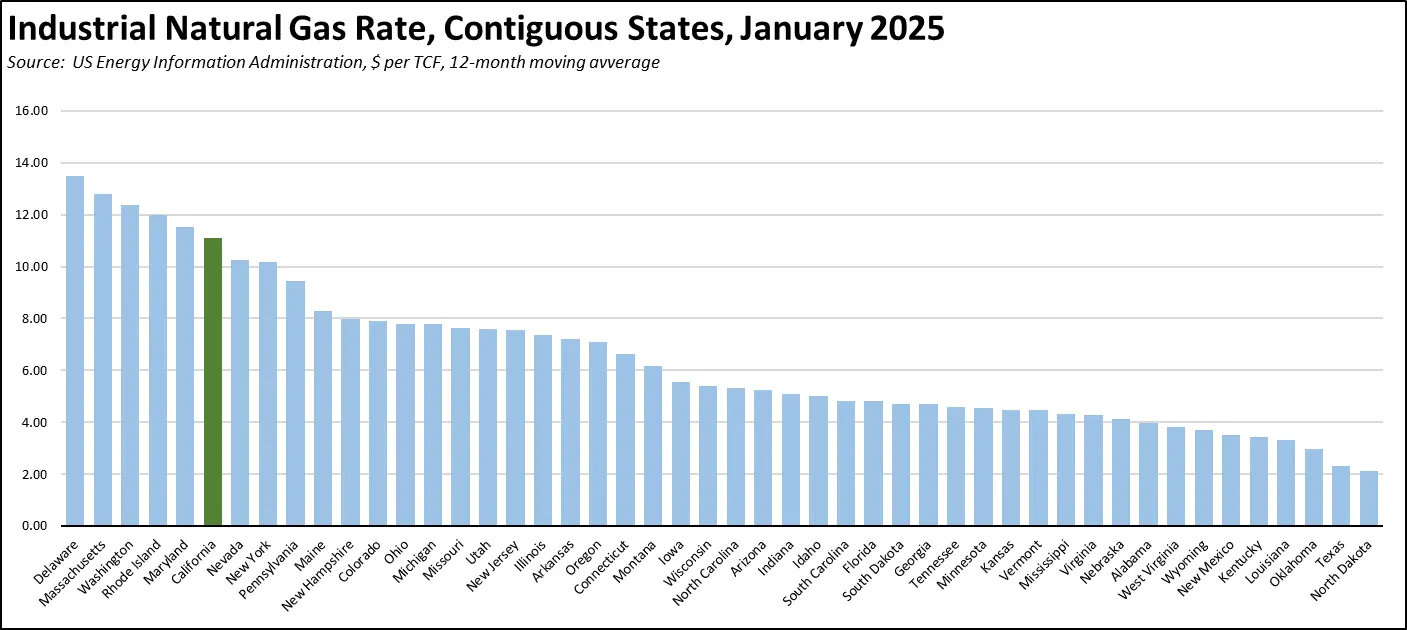
Natural gas rates while not yet the worst, have been quickly rising towards that milepost.
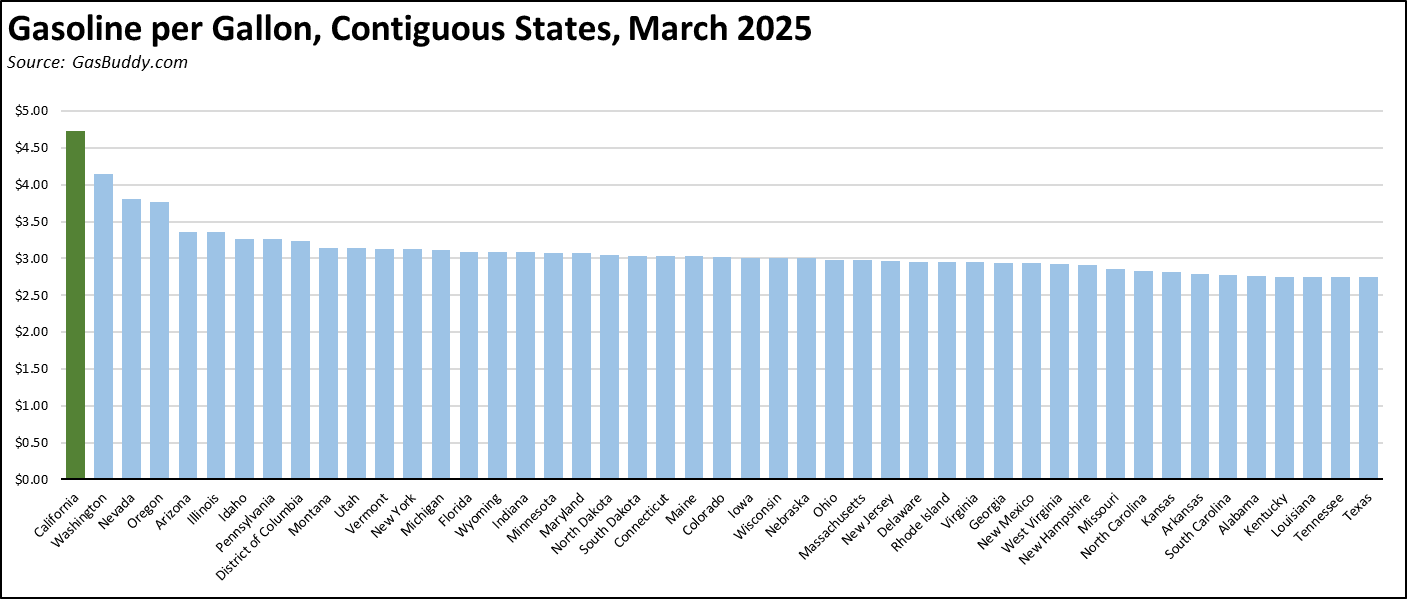
Fuel prices as a result of the state’s supply-limiting regulations combined with highest-in-the-nation taxes and fees have long held the number 1 slot.
The residential components feed directly into the growing costs of living for households. The commercial and industrial components raise these costs even further through higher prices for goods and services and business resources going to pay state demands in taxes and fees rather than labor compensation and jobs.
Inflation
For the 12 months ending February, the California CPI rose 3.0%, edging down from 3.2% in January. In the same period, the US CPI went to 2.8% in February from 3.0% in January. Using the same Department of Finance weighting formula, Food at Home (groceries) rose 1.6% in California compared to 1.9% for the US. Food Away from Home (restaurants and takeout) rose 5.2% compared to the US at 3.7%.
California Gasoline Taxes & Fees
Gallon of Gasoline
In March, California Energy Commission data indicates that $1.42 (31.7%) of the price of a gallon of regular gasoline was paid to cover state, local, and federal taxes and fees.
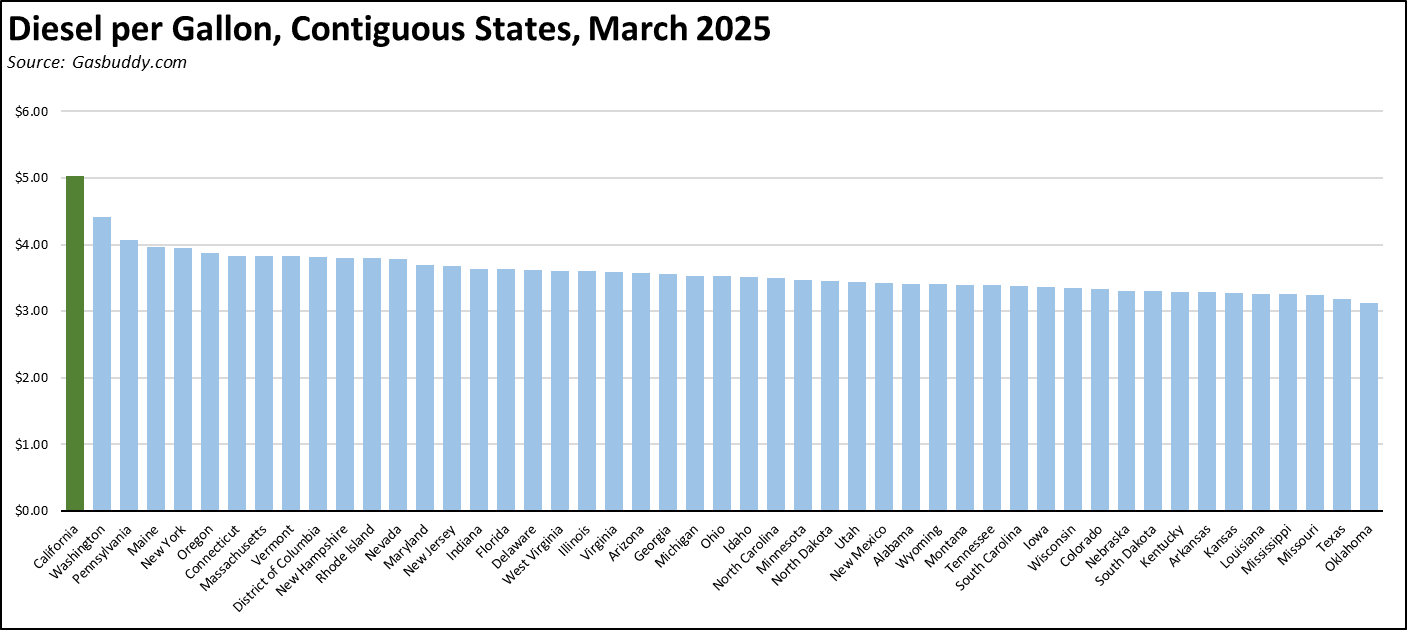
California vs. Rest of US Diesel Price
Above Other States
(CA Average)
The March average price per gallon of diesel in California eased 4 cents from February to $5.03. The California regulatory and tax premium above the average for the US other than California ($3.51) rose to $1.52, a 43.2% difference, as prices dipped faster in the other states.
price
In March, California had the highest diesel price among the contiguous states and DC.
Range Between Highest and Lowest Prices by Region
above Other States
(Central Coast Region)
The cost premium above the US (other than California) average price for regular gasoline ranged from $1.56 in the Inland Empire Region (average March price of $4.57), to $1.93 in Central Coast Region (average March price of $4.94).
Highest/Lowest Fuel Prices by Legislative District:
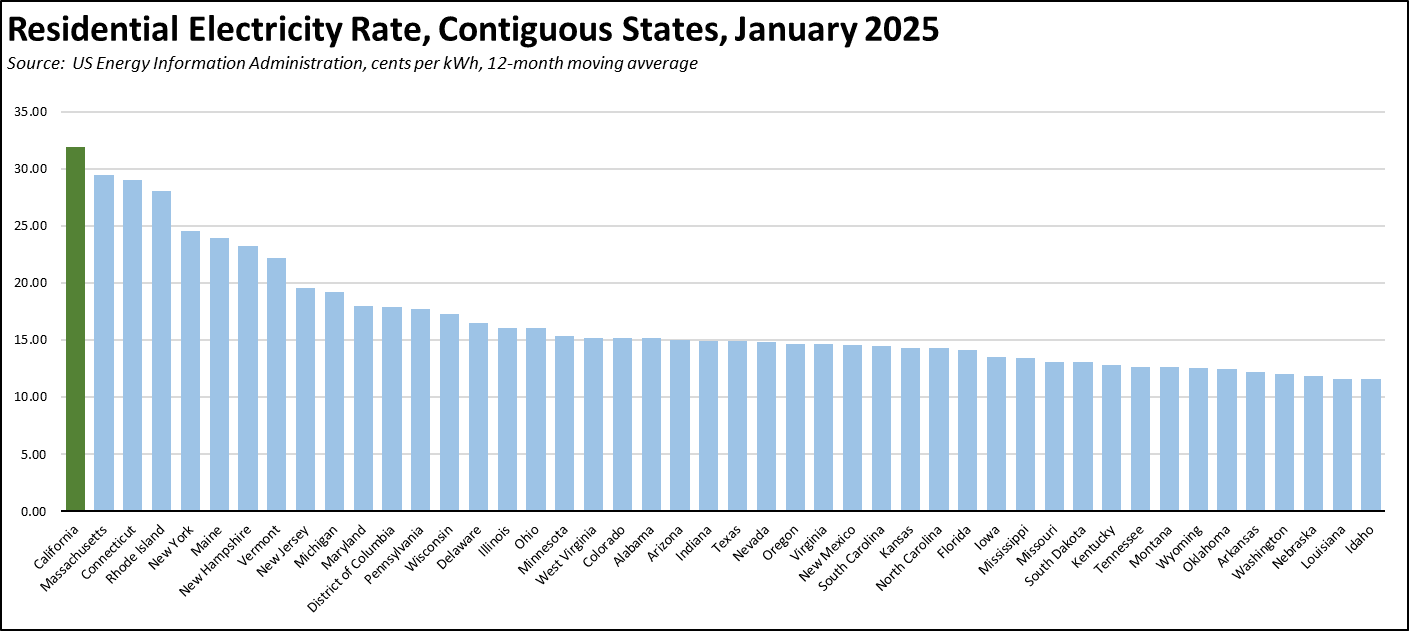
California Residential Electricity Price
Rest of US
California average Residential Price for the 12 months ended January 2025 was 31.87 cents/kWh, 104.3% higher than the US average of 15.60 cents/kWh for all states other than California. California’s residential prices were the highest among the contiguous states and DC.
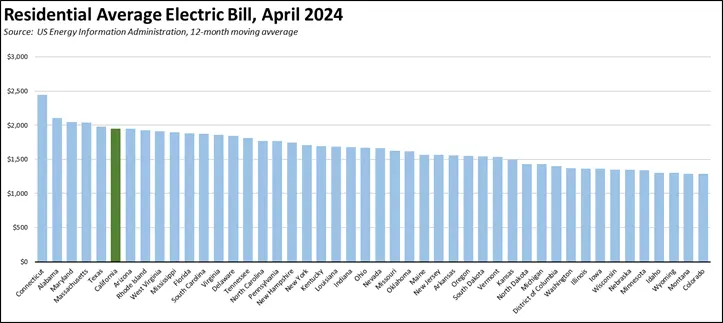
California Residential Electric Bill
For the 12 months ended January 2025, the average annual Residential electricity bill in California was $1947, or 95.9% higher ($953) than the comparable bill in 2010 (the year the AB 32 implementation began with the Early Action items). In this same period, the average US (less CA) electricity bill for all the other states grew only 25.6% ($349).
In 2010, California had the 9th lowest residential electricity bill among the contiguous states and DC. In the latest data, it had the 6th highest.
Residential bills, however, vary widely by region. Transforming the 2022 data from the Energy Commission, estimated annual household usage is as much as 82% higher in the interior regions compared to the milder climate coastal areas, and substantially higher when comparing across counties.
Rest of US
For the 12 months ended January 2025, California’s higher electricity prices translated into Residential ratepayers paying $14.1 billion more than the average ratepayers elsewhere in the US using the same amount of energy. Compared to the lowest cost state, California households paid $17.7 billion more.
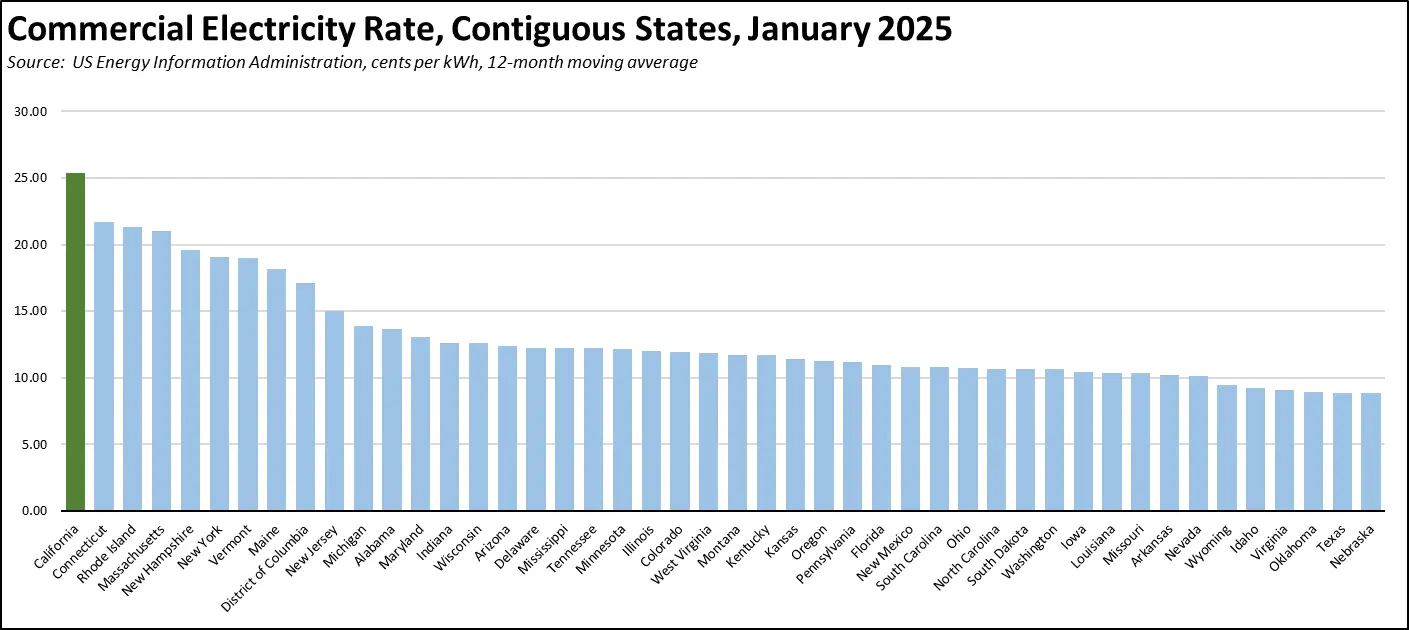
California Commercial Electricity Price
Rest of US
California average Commercial Price for the 12 months ended January 2025 was 25.35 cents/kWh, 113.2% higher than the US average of 11.89 cents/kWh for all states other than California. California’s commercial prices were the highest among the contiguous states and DC.
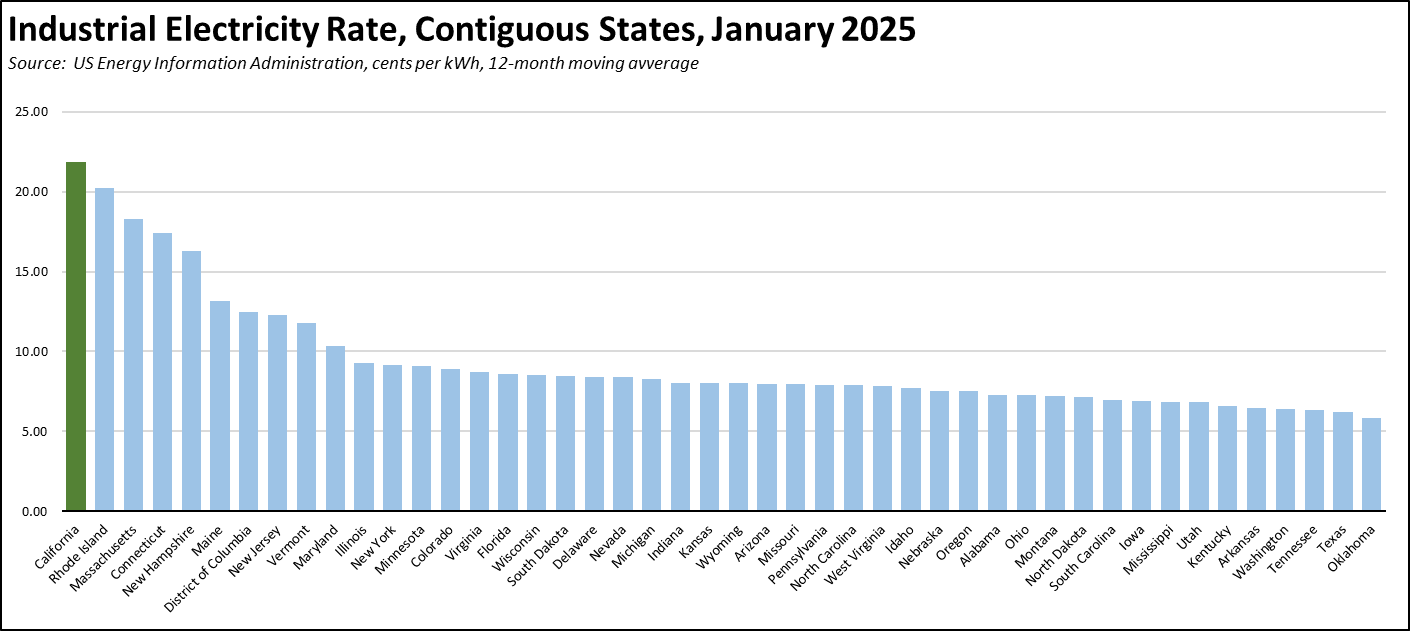
California Industrial Electricity Price
Rest of US
California average Industrial Price for the 12 months ended January 2025 was 21.83 cents/kWh, 187.2% higher than the US average of 7.60 cents/kWh for all states other than California. California’s industrial prices were the highest among the contiguous states and DC.
Rest of US
For the 12 months ended January 2025, California’s higher electricity prices translated into Commercial & Industrial ratepayers paying $21.6 billion more than ratepayers elsewhere in the US using the same amount of energy. Compared to the lowest rate states, Commercial & Industrial ratepayers paid $27.9 billion more.
California Natural Gas Prices
Average prices ($ per thousand cubic feet; 12-month moving average) for the 12 months ended January 2025 and changes from the previous 12-month period for each end user: