Below are the monthly updates from the most current May 2023 fuel price data (GasBuddy.com) and March 2023 electricity and natural gas price data (US Energy Information Administration). To view additional data and analysis related to the California economy, visit our website at www.centerforjobs.org/ca.
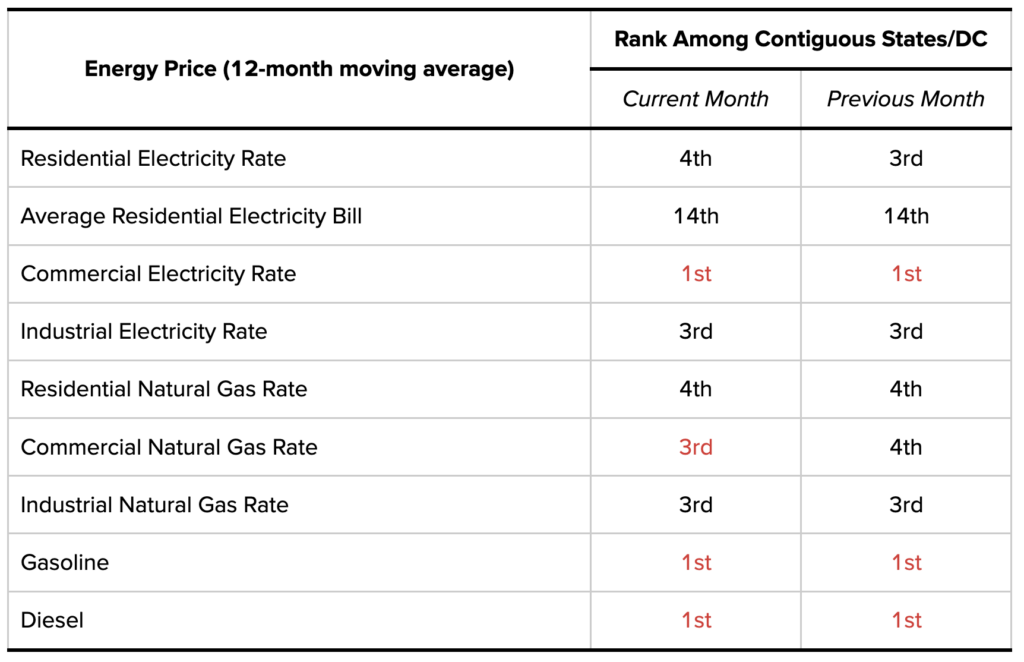
The additional costs under California policies, regulations, taxes, and fee add-ons continue to keep prices at the highest or near the highest among the contiguous states and DC across all energy sources. Natural gas prices show the state continuing to lose ground in its rankings as the higher prices due to pipeline shortages earlier this year are incorporated into the data.
![]()
The average gasoline price in May eased somewhat, down 6 cents in California and down 8 cents in the rest of the US. In the latest data from CSAA as of June 5, prices were unchanged nationally and edged up 3 cents in California. Price pressures going forward will come from increased demand as summer driving continues to pick up and a likely rise in world oil prices due to the recent OPEC production cuts. These cuts are partially offset by a 7.0% rise in US oil production (12-month average, March 2023 compared to March 2022), but will have less of an effect on California supplies as state production instead dropped 7.3% in this period. California prices will also rise due to the pending increase in gasoline and diesel taxes on July 1.
Diesel prices—a key factor in the cost of food and other goods—saw slightly higher price easing, down 15 cents in California and down 18 cents in the other states.
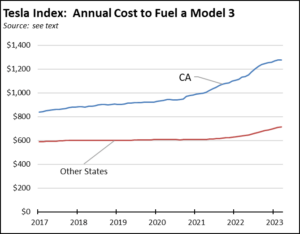
Average electricity rates and the average annual residential electricity bill continued to break records due to the sustained cost increases under the state’s energy and related polices. At the same time, state policies are being constructed to force households and employers into relying on this single source of energy. The evolving cost consequences are illustrated in the “Tesla Index” presented below. Comparing California costs to those in the rest of the US, this chart is based on the annual fuel costs for a Model 3 (long range), average residential rate, mileage estimates from the US EPA, and an average of 12,500 miles driven annually from US Department of Transportation data. Based on these assumptions, the Index has risen 52% since the Model 3 introduction in 2017 solely based on the soaring cost of electricity in this state. Note that actual costs will vary, depending on time of day charging, driving and charging behavior, differing costs of electricity by provider in different parts of the state, and access to in-home charging, with renters more likely to be dependent on more-costly public charging networks. Recent analyses have also suggested that the US EPA ratings under estimate actual energy use for electric vehicles. Even with these caveats, the chart illustrates the extent to which rising electricity costs are undermining the economics of other policies now being pursued by the state.
Inflation Continues to Ease
For the 12 months ending March, the California CPI rose 4.2%, down from 5.4% in February. In the same period, the US CPI rose 5.0%, down from 6.0%.
California vs. US Diesel Price
Above US Average
(CA Average)
The May average price per gallon of diesel in California eased 15 cents from April to $5.14. The California premium above the average for the US other than California ($3.91) edged up to $1.23, a 31.4% difference.
price
In May, California again had the highest diesel price among the contiguous states and DC.
Range Between Highest and Lowest Prices by Region
The cost premium above the US (other than California) average price for regular gasoline ranged from $1.28 in the Sacramento Region (average May price of $4.73), to $1.55 in Central Sierra Region (average May price of $5.00)
Highest/Lowest Fuel Prices by Legislative District:
| May 2023: Average Price ($ per gallon) of Regular Gasoline | |||
| Highest | Lowest | ||
| CD02 Huffman (D) | $5.07 | CD13 Duarte (R) | $4.70 |
| CD30 Schiff (D) | $5.04 | CD07 Matsui (D) | $4.68 |
| CD32 Sherman (D) | $4.98 | CD06 Bera (D) | $4.65 |
| CD50 Peters (D) | $4.97 | CD09 Harder (D) | $4.63 |
| CD11 Pelosi (D) | $4.96 | CD01 LaMalfa (R) | $4.63 |
| SD02 McGuire (D) | $5.03 | SD33 Gonzalez (D) | $4.77 |
| SD24 Allen (D) | $5.00 | SD14 Caballero (D) | $4.75 |
| SD39 Atkins (D) | $4.99 | SD06 Niello (R) | $4.68 |
| SD17 Laird (D) | $4.99 | SD08 Ashby (D) | $4.66 |
| SD26 Durazo (D) | $4.96 | SD05 Eggman (D) | $4.61 |
| AD02 Wood (D) | $5.13 | AD07 Hoover (R) | $4.63 |
| AD51 Zbur (D) | $5.08 | AD10 Nguyen (D) | $4.61 |
| AD30 Addis (D) | $5.08 | AD22 Alanis (R) | $4.60 |
| AD77 Boerner Horvath (D) | $5.03 | AD13 Villapudua (D) | $4.58 |
| AD44 Friedman (D) | $5.03 | AD03 Gallagher (R) | $4.53 |
California Residential Electricity Price
California average Residential Price for the 12 months ended March 2023 was 26.55 cents/kWh, 79.0% higher than the US average of 14.83 cents/kWh for all states other than California. California’s residential prices were the 4th highest among the contiguous states and DC.
California Residential Electric Bill
For the 12 months ended March 2023, the average annual Residential electricity bill in California was $1,736, or 74.6% higher ($742) than the comparable bill in 2010 (the year the AB 32 implementation began with the Early Action items). In this same period, the average US (less CA) electricity bill for all the other states grew only 23.0% ($314).
In 2010, California had the 9th lowest residential electricity bill among the contiguous states and DC. In the latest data, it again had the 14th highest.
Residential bills, however, vary widely by region, with the estimated annual household usage in the recent released data for 2020 as much as 78% higher in the interior regions compared to the milder climate coastal areas, and substantially higher when comparing across counties.
US Average Price
For the 12 months ended March 2023, California’s higher electricity prices translated into Residential ratepayers paying $10.7 billion more than the average ratepayers elsewhere in the US using the same amount of energy. Compared to the lowest cost state, California households paid $14.7 billion more.
California Commercial Electricity Price
California average Commercial Price for the 12 months ended March 2023 was 22.24 cents/kWh, 86.1% higher than the US average of 11.95 cents/kWh for all states other than California. California’s commercial prices were the 3rd highest among the contiguous states and DC.
California Industrial Electricity Price
California average Industrial Price for the 12 months ended March 2023 was 17.87 cents/kWh, 117.4% higher than the US average of 8.22 cents/kWh for all states other than California. California’s industrial prices again were the 3rd highest among the contiguous states and DC.
US Average Price
For the 12 months ended March 2023, California’s higher electricity prices translated into Commercial & Industrial ratepayers paying $16.3 billion more than ratepayers elsewhere in the US using the same amount of energy. Compared to the lowest rate states, Commercial & Industrial ratepayers paid $21.3 billion more.
California Natural Gas Prices
Average prices ($ per thousand cubic feet; 12-month moving average) for the 12 months ended March 2023 and changes from the previous 12-month period for each end user:
| Residential | Commercial | Industrial | |
| CA, March 2023 | $21.78 | $17.19 | $16.70 |
| CA, March 2022 | $17.82 | $13.21 | $11.05 |
| Change | 22.2% | 30.1% | 51.1% |
| Rest of US, March 2023 | $15.59 | $10.11 | $9.52 |
| Rest of US, March 2022 | $13.06 | $9.65 | $6.27 |
| Change | 19.4% | 4.8% | 51.8% |
| CA premium over Rest of US, March 2023 | 39.7% | 70.0% | 75.4% |
| CA premium over Rest of US, March 2022 | 36.4% | 36.9% | 76.2% |