Below are the monthly updates from the most current May 2025 fuel price data (GasBuddy.com) and March 2025 electricity and natural gas price data (US Energy Information Administration). To view additional data and analysis related to the California economy visit our website at www.centerforjobs.org/ca.
Gasoline & Diesel Prices Set to Surge Higher
California’s energy cost rankings showed little change in the most recent data except for some easing for average residential electricity bills as California managed to fall $3-10 below Arizona, West Virginia, and Rhode Island.
While retaining the #1 spot among the contiguous states and DC for fuel costs, California also is now set to expand the costs even further through pending increases in state taxes and fees. Beginning July 1, the gasoline excise tax will rise 1.6 cents to 61.2 cents a gallon, putting the total tax rise up 106% since 2017. Diesel will also rise 1.2 cents to 46.6 cents, a 29.4% increase since 2017.
More significantly, Air Resources Board has announced they intend to move forward with their delayed LCFS cost increases beginning in July as well. While most of the controversy over this costly measure has focused on the impacts to gasoline prices, the higher LCFS costs will also apply to diesel—affecting transport costs for food and other consumer goods—and to jet fuel, adding yet more cost disadvantages to the key tourism industry at a time when it is already facing signs of a significant drop in travel.
With the state senate in essence acting to approve the LCFS regulations, previous analyses indicate the rules could add 65 cents a gallon in 2026 and rising every year after. As below, we will continue to track these costs.
An additional unknown affecting fuel costs this year is the potential outcome of the governor’s proposal to reauthorize Cap & Trade. As indicated below, the softening of climate credit markets in general has seen at least some easing in the cost impact of this state fee in recent months, but this trend could be reversed depending on the final outcomes in any reauthorization. The state has become more dependent on these fee revenues particularly as budget proposals increasingly look to this source as a backfill for general fund shortfalls. But at the same time, revenues are falling. The most recent auction in May saw only 73% of the current allowances offered by the state sold, the only time since August 2020 an auction was undersubscribed. Advanced allowances did fully sell but came from a much lower offering total. The Air Board has not yet reported on the total proceeds, but information in the Auction Summary Report indicates the state only received $596 million compared to $851 million from the February auction and an average of $1.238 billion per auction in FY 2023-24.
Inflation
For the 12 months ending March, the California CPI rose 2.8%, easing from 3.0% for the year ending February. In the same period, the US CPI went to 2.4% in March from 2.8% in February. Using the same Department of Finance weighting formula, Food at Home (groceries) rose 2.5% in California compared to 2.4% for the US. Food Away from Home (restaurants and takeout) rose 5.2% compared to the US at 3.8%.
California Gasoline Taxes & Fees
Gallon of Gasoline
As they are set to rise substantially beginning in July, the Energy Commission apparently has stopped publishing data on the tax and fee components of gasoline in the state. The Gasoline Price Breakdown and Margins data containing details on taxes and environmental fees was last updated for the week of March 31. The Commission has again begun updating the similar margin analysis required under SB 1322, but with only partial information and with the most recent update only for February.
In the absence of current Commission data, these gasoline cost drivers are instead estimated using the new OPIS data and the other data sources and assumptions in the Commission’s method. In May, $1.43 (29.5%) of the price for a gallon of regular gasoline was paid to cover state, federal, and local taxes and fees.
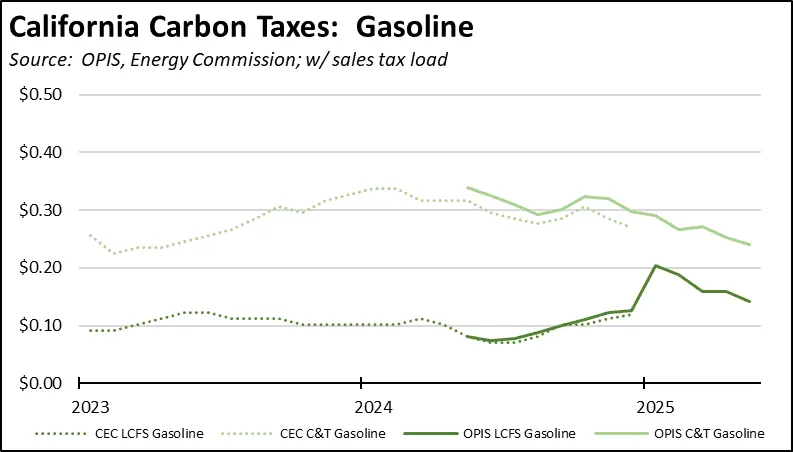
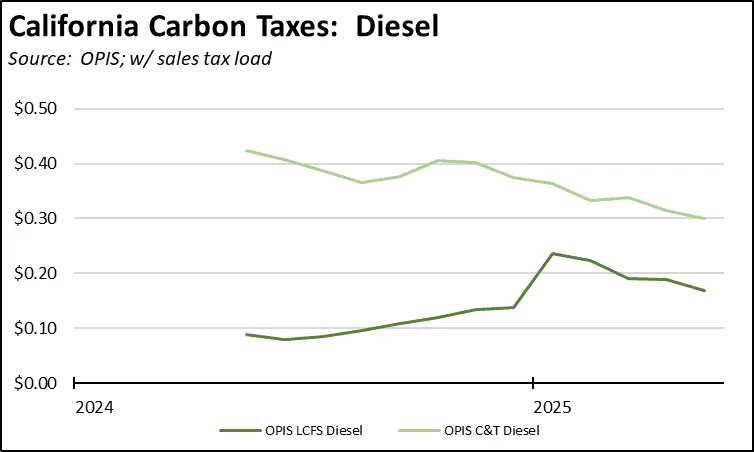
California Carbon Taxes: LCFS and Cap & Trade
In May, total LCFS and Cap & Trade charges incorporated in the price Californians pay for fuel eased somewhat as prices in the underlying carbon markets softened. The costs shown in the table are for the penultimate month-to-date numbers from the OPIS Carbon Market Report, adjusted to incorporate state and local sales tax to account for the full additional costs imposed by these regulatory fees on fuel buyers. Certain Data or Information Provided By: Oil Price Information Service, LLC. Distribution of OPIS data without permission from OPIS is prohibited.
Combining the OPIS data (without the sales tax component) with the previous Energy Commission estimates, Cap & Trade costs have been easing, while LCFS costs have been rising since mid-last year. As indicated in the Gasoline chart, the Commission apparently has only been incorporating Cap and Trade costs only on fuel use incurred at the rack and has not been including the portion levied on refinery operations. And as indicated above, the LCFS component is set to accelerate the current trend beginning in July.
California vs. Rest of US Diesel Price
Above Other States
(CA Average)
The May average price per gallon of diesel in California rose 6 cents from April to $5.06. The California regulatory and tax premium above the average for the US other than California ($3.42) rose to $1.64, a 48.0% difference.
price
In May, California had the highest diesel price among the contiguous states and DC.
Range Between Highest and Lowest Prices by Region
above Other States
(Central Coast Region)
The cost premium above the US (other than California) average price for regular gasoline ranged from $1.61 in the Inland Empire Region (average May price of $4.64), to $2.11 in Central Coast Region (average May price of $5.14).
Highest/Lowest Fuel Prices by Legislative District:
California Residential Electricity Price
Rest of US
California average Residential Price for the 12 months ended March 2025 was 31.89 cents/kWh, 103.5% higher than the US average of 15.67 cents/kWh for all states other than California. California’s residential prices were the highest among the contiguous states and DC.
California Residential Electric Bill
For the 12 months ended March 2025, the average annual Residential electricity bill in California was $1,946, or 95.8% higher ($952) than the comparable bill in 2010 (the year the AB 32 implementation began with the Early Action items). In this same period, the average US (less CA) electricity bill for all the other states grew only 27.5% ($376).
In 2010, California had the 9th lowest residential electricity bill among the contiguous states and DC. In the latest data, it instead had the 9th highest.
Residential bills, however, vary widely by region. Transforming the 2022 data from the Energy Commission, estimated annual household usage is as much as 82% higher in the interior regions compared to the milder climate coastal areas, and substantially higher when comparing across counties.
Rest of US
For the 12 months ended March 2025, California’s higher electricity prices translated into Residential ratepayers paying $14.0 billion more than the average ratepayers elsewhere in the US using the same amount of energy. Compared to the lowest cost state, California households paid $17.7 billion more.
California Commercial Electricity Price
Rest of US
California average Commercial Price for the 12 months ended March 2025 was 25.39 cents/kWh, 112.3% higher than the US average of 11.96 cents/kWh for all states other than California. California’s commercial prices were the highest among the contiguous states and DC.
California Industrial Electricity Price
Rest of US
California average Industrial Price for the 12 months ended March 2025 was 21.96 cents/kWh, 186.3% higher than the US average of 7.67 cents/kWh for all states other than California. California’s industrial prices were the highest among the contiguous states and DC.
Rest of US
For the 12 months ended March 2025, California’s higher electricity prices translated into Commercial & Industrial ratepayers paying $21.6 billion more than ratepayers elsewhere in the US using the same amount of energy. Compared to the lowest rate states, Commercial & Industrial ratepayers paid $28.0 billion more.
California Natural Gas Prices
Average prices ($ per thousand cubic feet; 12-month moving average) for the 12 months ended March 2025 and changes from the previous 12-month period for each end user: