Below are the monthly updates from the most current October 2020 fuel price data (GasBuddy.com) and August 2020 electricity and natural gas price data (US Energy Information Agency). To view additional data and analysis related to the California economy visit our website at www.centerforjobs.org/ca.
Energy use provides another indicator of the effects coming from the current shutdowns related to the pandemic. In the period April through August, residential electricity use in California was up 12.4% from the comparable period in 2019, indicating yet another measure of the extent to which telecommuting has sustained a significant portion of the economy under the current crisis conditions. In contrast, commercial electricity use was down 10.2%, reflecting the impact of the closure orders, while industrial use was largely unchanged. The rest of the country, however, showed considerably lower effects, with residential use largely unchanged, commercial use down 3.9%, and industrial down 4.8%.
As reflected in the numbers below, the costs of energy in California continue to rise relative to the rest of the nation as a result of state regulations. In the current circumstances, these growing costs continue to impose a disparate burden to the lower wage households who have seen the highest loss of jobs as a result of the state-ordered closures. Their incomes are down, but the energy-related costs of housing and transportation continue to rise. This growing cost of living and cost of business component will also remain a barrier to household and employment recovery in the coming period.
Our August Energy Report estimated that the state’s climate change regulations now cost California households and employers $44 billion more a year when the cost of energy is compared to the average for the other states, and more if the consumption levels had been closer to the pre-COVID levels. This estimate is also based on a comparison to the average prices in the rest of the US and does not take into account the state’s ability in the past to provide reliable energy at lower prices, contributing to the state’s competitiveness in the past for both residents and businesses.
But as indicated in that report, the additional cost of $44 billion a year is not the cost of a climate change program. It is the cost of the way the state has chosen to pursue its program, relying heavily on a constantly expanding—even under the current unprecedented health and economic crisis conditions—body of regulations.
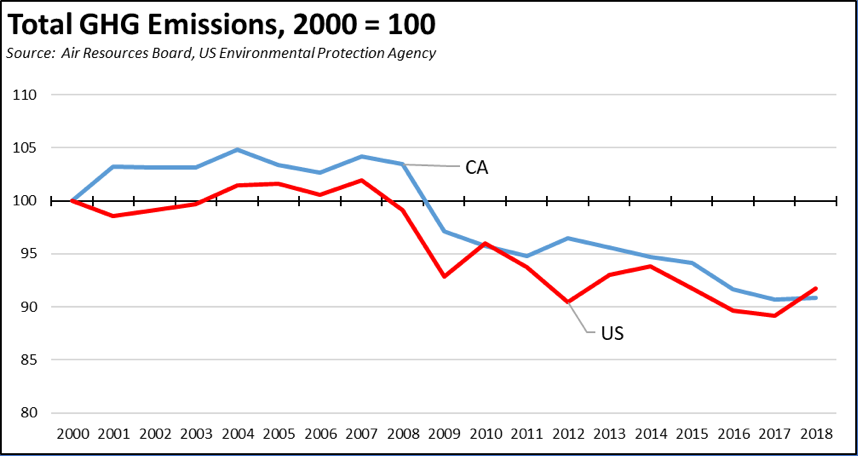
The recent Air Resources Board release of the emissions inventory for 2018 provides an update to the performance of the state’s regulation-heavy approach to climate change compared to the more cost-considered solutions pursued largely in the rest of the country.
California emissions saw an uptick in 2018, similar to but at a lower level than for the US as whole. California’s total included emissions were 1.3% below the 1990 level. The US was 3.7% above, indicating as in prior years that progress on the national level has trailed California by only 1 to 2 years. Overall in the period covered by the current inventory, progress in reducing climate change emissions has differed little in outcomes between California and the US. The only difference has been the substantially higher costs California has imposed to achieve those outcomes.
While there are some differences in how each agency calculates the emission inventories reflected in the chart, both are done in conformance with IPCC requirements. Differences in core elements include the following considerations:
- Significant progress on both the state and federal level was reliant on the Great Recession. The most significant drops in emission levels were not the result of regulation or any other policy action, but instead came through restructuring from the economic drop in 2008 and subsequent shallow recovery. The outcome from the current crisis is as yet unknown. While emissions have dropped sharply from reduced transportation use, the longer term effects are unclear—whether businesses will return to prior operation levels or whether yet another shallow recovery will instead see another round of restructuring as operations are shifted to other locations.
- Transportation remains a key source at both the state and federal levels. Excluding transportation, emission reductions from all other sectors have been much stronger at 12% below the 2000 level (vs. 9% total) in California, and 11% below (vs. 8% total) for the US. While California’s regulations related to transportation remain focused on trying to change how people live and work—with no measurable results to date—the sharp rise in telecommuting during the current crisis has produced substantial reductions in transportation emissions and promises to sustain those reductions as telework is expanded as a normal employment arrangement in the post-recovery period. In sharp contrast to the cost-heavy approach used by California to date, these substantial emission reductions are being achieved at cost savings to the workers and households now adopting this option. Beginning with the 2020 data, the emissions numbers are consequently likely to show substantial improvements, not because of regulations or other agency actions but because workers have chosen to shift to an employment option that better balances their work and family demands.
- The California progress continues to be reliant not so much on climate actions but on the weather. Energy Commission electricity generation data indicates that emission reductions in 2016 and 2017 in particular but continuing into 2018 came as the result of replacing a substantial portion of in-state production from natural gas plants with higher hydroelectric output. In-state solar is just now beginning to make up for annual variations in hydroelectricity.
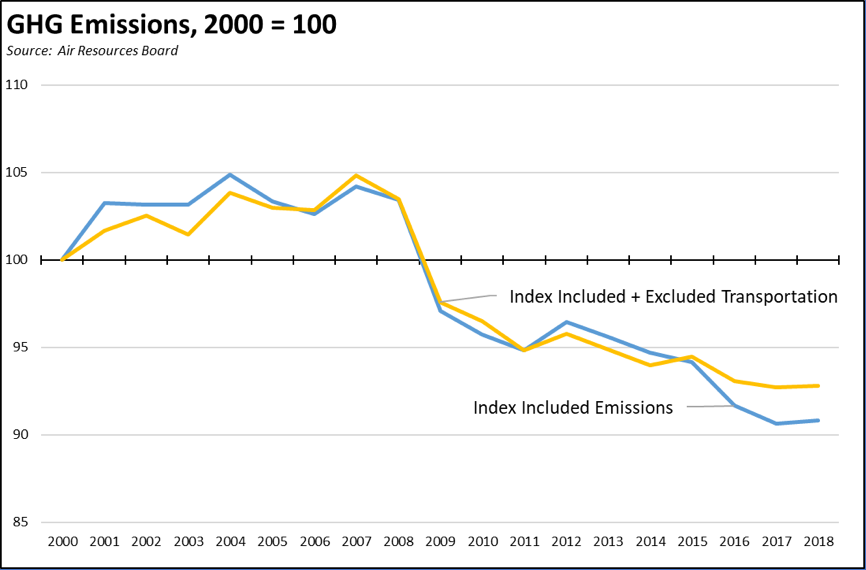
- The data in the graph above for California covers only included emissions. Two key components are left out. First, emissions excluded from the inventory notably include aviation and marine traffic. In some instances, California’s regulations continue to not as much reduce emissions but shift where they are generated as the state increases imports of what it uses. This effect is illustrated in the following chart which takes the index for emissions included in the inventory as above and shows the effect if excluded emissions for aviation and marine are incorporated. Total emissions in this case are more sensitive to economic levels, as consumption, travel, and imports decline during economic downturns, but grow as recovery takes hold. Note this graph includes only the transportation for goods no longer produced in the state, and not the associated extraction and production emissions in other locations.
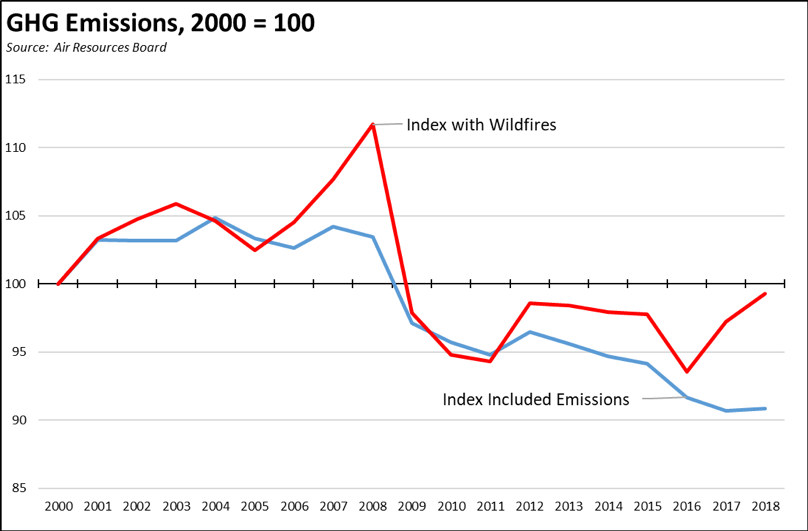
The second element as sharply illustrated this year are emissions from wildfires which in many years exceed whatever reductions are gleaned from the state’s regulations and their associated high costs on residents and employers. The following chart illustrates this point by combining the Air Board inventory’s included emissions along with the preliminary estimates of CO2 emissions from annual wildfires. In spite of the potential of wildfires to fully negate if not exceed the costly reductions achieved through the state’s regulations, reducing the incidence and severity of fires remains a relatively low priority under the cap and trade spending program, the primary source of discretionary funds to reduce climate change emissions in the state. Using the 2019-20 budget bill as a more representative allocation, reducing wildfire threats was allocated only 7% of the $2.9 billion Expenditure Plan. The approved spending instead was heavy with elements that contained only minimal to no emissions reduction potential including $1.3 billion for transit, High-Speed Rail, and the Strategic Growth Council.
While the most current data shows an uptick in emissions in 2018, the longer-term trend shows continued reductions from the state’s efforts. These reductions, however, are little different than what the country as a whole has achieved in the same period at far lower cost, and the progress for California is only in the emissions that are included in the reporting and not the full outcomes from the state’s budgetary and policy decisions. The growing costs on households and employers from the state’s chosen approach have to be considered in this context.
California vs. US Diesel Price
Above US Average
(CA Average)
The October average price per gallon of diesel in California eased 2 cents from September to $3.34. The California premium above the average for the US other than California ($2.31) rose to $1.03, a 44.5% difference.
In October, California had the 2nd highest diesel price among the states and DC, behind only Hawaii.
Range Between Highest and Lowest Prices by Region
Above US Average
(Central Sierra Region)
The cost premium above the US (other than California) average price for regular gasoline ranged from $1.03 in the Central Valley Region (average October price of $3.11), to $1.26 in Central Sierra Region (average October price of $3.34).
Highest/Lowest Fuel Prices by Legislative District:
California Residential Electricity Price
Rest of US
California average Residential Price for the 12 months ended August 2020 was 19.74 cents/kWh, 56.3% higher than the US average of 12.63 cents/kWh for all states other than California. California’s residential prices remained the 6th highest in the nation.
California Residential Electric Bill
For the 12 months ended August 2020, the average annual Residential electricity bill in California was $1,297, or 30.5% higher ($303) than the comparable bill in 2010 (the year the AB 32 implementation began with the Early Action items). In this same period, the average US (less CA) electricity bill for all the other states grew only 3.4% ($47).
Residential bills, however, vary widely by region, with the estimated annual household usage in 2018 as much as 59% higher in the interior regions compared to the milder climate coastal areas.
US Average Price
For the 12 months ended August 2020, California’s higher electricity prices translated into Residential ratepayers paying $6.5 billion more than the average ratepayers elsewhere in the US using the same amount of energy.
California Commercial Electricity Price
Rest of US
California average Commercial Price for the 12 months ended August 2020 was 17.45 cents/kWh, 74.2% higher than the US average of 10.02 cents/kWh for all states other than California. California’s commercial prices remained the 3rd highest in the nation.
California Industrial Electricity Price
Rest of US
California average Industrial Price for the 12 months ended August 2020 was 14.18 cents/kWh, 125.1% higher than the US average of 6.30 cents/kWh for all states other than California. California’s industrial prices remained the 4th highest in the nation.
US Average Price
For the 12 months ended August 2020, California’s higher electricity prices translated into Commercial & Industrial ratepayers paying $11.6 billion more than ratepayers elsewhere in the US using the same amount of energy.
California Natural Gas Prices
Average prices ($ per thousand cubic feet) for the 12 months ended August 2020 and changes from the previous 12-month period for each end user: