Below are the monthly updates from the most current October 2024 fuel price data (GasBuddy.com) and August 2024 electricity and natural gas price data (US Energy Information Administration). To view additional data and analysis related to the California economy visit our website at www.centerforjobs.org/ca.
Residential Electricity Rates Again More than Double the Average for the Rest of the US
In August, California average residential electricity rates (12-month moving average) were 105.6% higher than in the rest of the US. Electricity rates across all three primary end users as well as the cost of fuels remained the highest in the contiguous states.
The Center’s electricity data series have been updated with the final rates for 2023 from the US Energy Information Administration. In the final accounting, the average residential utility bill in California increased to $1,736 for the year from the preliminary level of $1,707. As a result, the average California bill rose from 17th highest among the contiguous states to 13th highest. The revised average annual bill in the other states and DC was $1,631.
California Already the Highest--Poised to Go Even Higher
In October, the average price for regular gasoline in California was again the highest among the contiguous states and in fact were the highest among all the states. As discussed repeatedly including by state Department of Justice past investigations and by the regulatory agencies, the primary driver of this growing cost differential are California’s state-specific formulation rules along with the costs of state and local fuel taxes and other mandate costs.
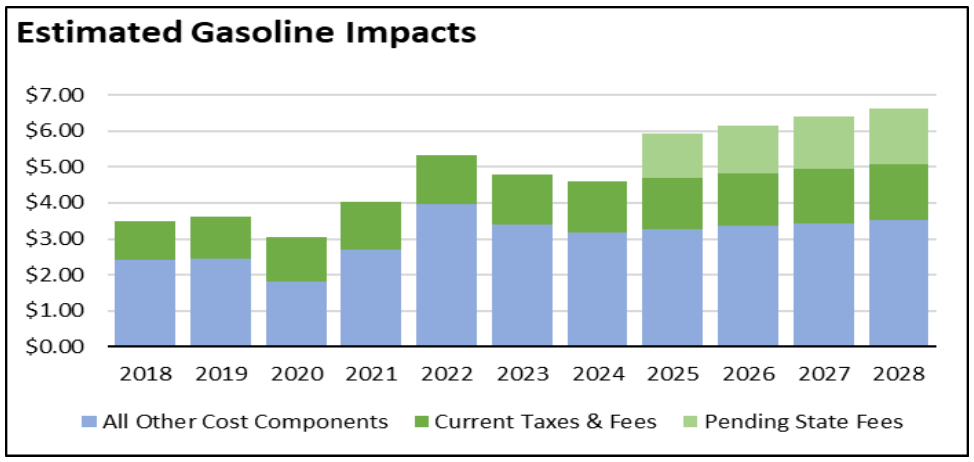
Although already comprising just under a third of the per gallon cost in the latest estimates from the Energy Commission, the tax and fee cost component of each gallon of gasoline is now set to go even higher.
- In the just-concluded Special Session, the legislature and governor agreed to impose yet another set of California-only requirements on the production and sale of fuels in the state with new regulations requiring diversion of the current limited production capacity to state-determined storage levels. Although the eventual cost of this new mandate is currently unknown, the Center’s recent analysis expects a final cost of $610 million to $1.8 billion annually to California households and employers.
- Based on their economic impact statement, the current cap and trade amendments currently being considered by the Air Resources Board would result in additional costs (levelized) of 22 cents a gallon, or equivalent to $2.7 billion a year.
- Again based on their economic impact statement, the Low Carbon Fuel Standard (LCFS) amendments also being considered by the Air Board would increase gasoline costs by $5.8 billion a year starting in 2025. These costs would continue rising as this new regulatory premium would increase from 47 cents a gallon in 2025 to $1.83 by 2041. Although not receiving as much attention as the gasoline impacts, the proposed regulations would also apply to diesel, increasing costs–based on the economic impact statement–by 59 cents a gallon in 2025 and increasing to $2.40 a gallon by 2041. These diesel costs will have a direct effect on the cost of goods throughout the state, ranging from food to other household essentials.
- The proposed regulations have since been modified, but the Air Board has to date refused to update the cost estimates while the staff has attempted to distance their actions from any responsibility for rising costs in the state. However, a separate analysis by University of Pennsylvania’s Kleinman Center for Energy Policy–using the same methods and data as in the Air Board’s initial economic impact statement–estimates that the amended regulations would increase costs to 85 cents a gallon initially, rising to $1.50 a gallon by 2035 (vs. Air Board estimate of 79 cents in 2035). This report did not address the potential diesel costs. Using these numbers, the total cost from the effect on gasoline prices would be $8.0 billion beginning in 2025 and rising in the subsequent years.
- Combining all three actions, the total impact beginning in 2025 to households and employers would be up to $12.5 billion (gasoline only), expanding the current cost of all gasoline taxes and fees by another 70%.
These cost impacts, however, are all calculated in constant dollars, generally using 2023 dollars as the base. The actual effect on prices will be subject to a number of issues including any unexpected effects coming from the new storage requirements once they are actually turned into real requirements, overall trends in gasoline consumption and in-state production capacity, and changes to the assumptions under which these costs were estimated.
Putting these into expected cost effects based on current dollars uses the following assumptions:
- Average prices and current taxes and fees to date are based on the Energy Commission estimates. The 2024 data is based on the year to date through October.
- The current US Energy Information Administration Annual Energy Outlook expects gasoline prices for the Pacfic Coast states to be essentially stable (constant dollars) in the near term. The base gasoline prices consequently are assumed to grow in accordance with the current Department of Finance inflation projections.
- The constant dollar impact estimates are similarly turned into current dollars using the Department of Finance inflation projections.
Using this simple estimation approach results in the following gasoline prices in California. Overall, price per gallon would grow from an average of $3.48 in 2018 to just under $6.00 in 2025 and $6.63 by 2028. These are averages. Monthly and weekly prices would continue to be subject to the by-now-normal swings due to changes in the seasonal formulation requirements, imported oil prices due to the state’s increasing dependence on this source, and unexpected events from an increasingly smaller in-state production capacity. Total taxes and fees would go from their current one-third of the total pump price, to just under one-half.

California Gasoline Taxes & Fees
Gallon of Gasoline
In October, California Energy Commission data indicates that $1.44 (32.7%) of the price of a gallon of regular gasoline was paid to cover state, local, and federal taxes and fees.
California vs. Rest of US Diesel Price
(CA Average)
The October average price per gallon of diesel in California eased 2 cents from September to $4.93. The California regulatory and tax premium above the average for the US other than California ($3.49) eased to $1.44, a 41.4% difference.
price
In October, California again had the highest diesel price among the contiguous states and DC.
Range Between Highest and Lowest Prices by Region
above Other States
(Central Sierra Region)
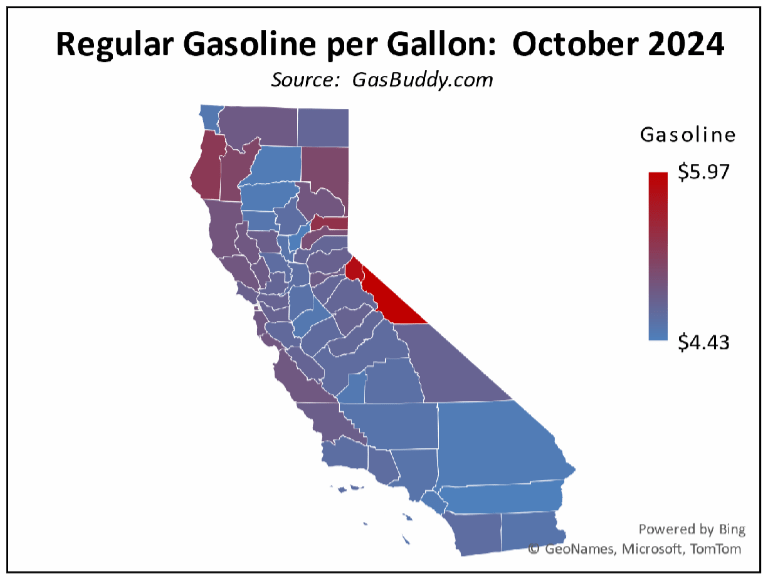
The cost premium above the US (other than California) average price for regular gasoline ranged from $1.40 in the Inland Empire Region (average October price of $4.45), to $1.85 in Central Sierra Region (average October price of $4.90).

Highest/Lowest Fuel Prices by Legislative District:
California Residential Electricity Price
Rest of US
California average Residential Price for the 12 months ended August 2024 was 31.46 cents/kWh, 105.4% higher than the US average of 15.32 cents/kWh for all states other than California. California’s residential prices again were the highest among the contiguous states and DC.
California Residential Electric Bill
For the 12 months ended August 2024, the average annual Residential electricity bill in California was $1871, or 88.2% higher ($877) than the comparable bill in 2010 (the year the AB 32 implementation began with the Early Action items). In this same period, the average US (less CA) electricity bill for all the other states grew only 22.6% ($308).
In 2010, California had the 9th lowest residential electricity bill among the contiguous states and DC. In the latest data, it had the 10th highest.
Residential bills, however, vary widely by region. Transforming the 2022 data recently released by the Energy Commission, estimated annual household usage is as much as 82% higher in the interior regions compared to the milder climate coastal areas, and substantially higher when comparing across counties.
Rest of US
For the 12 months ended August 2024, California’s higher electricity prices translated into Residential ratepayers paying $13.6 billion more than the average ratepayers elsewhere in the US using the same amount of energy. Compared to the lowest cost state, California households paid $16.9 billion more.
California Commercial Electricity Price
Rest of US
California average Commercial Price for the 12 months ended August 2024 was 25.20 cents/kWh, 115.9% higher than the US average of 11.67 cents/kWh for all states other than California. California’s commercial prices again were the highest among the contiguous states and DC.
California Industrial Electricity Price
Rest of US
California average Industrial Price for the 12 months ended August 2024 was 20.81 cents/kWh, 177.1% higher than the US average of 7.51 cents/kWh for all states other than California. California’s industrial prices again were the highest among the contiguous states and DC.
Rest of US
For the 12 months ended August 2024, California’s higher electricity prices translated into Commercial & Industrial ratepayers paying $21.2 billion more than ratepayers elsewhere in the US using the same amount of energy. Compared to the lowest rate states, Commercial & Industrial ratepayers paid $26.9 billion more.
California Natural Gas Prices
Average prices ($ per thousand cubic feet; 12-month moving average) for the 12 months ended August 2024 and changes from the previous 12-month period for each end user:
