Below are the monthly updates from the most current September 2024 fuel price data (GasBuddy.com) and July 2024 electricity and natural gas price data (US Energy Information Administration). To view additional data and analysis related to the California economy visit our website at www.centerforjobs.org/ca.
Average Residential Electricity Bill 10th Highest
In July, California average residential electricity jumped to 10th highest among the contiguous states, compared to 9th lowest in 2010. Electricity rates across all three primary end users as well as the cost of fuels remained the highest in the contiguous states.
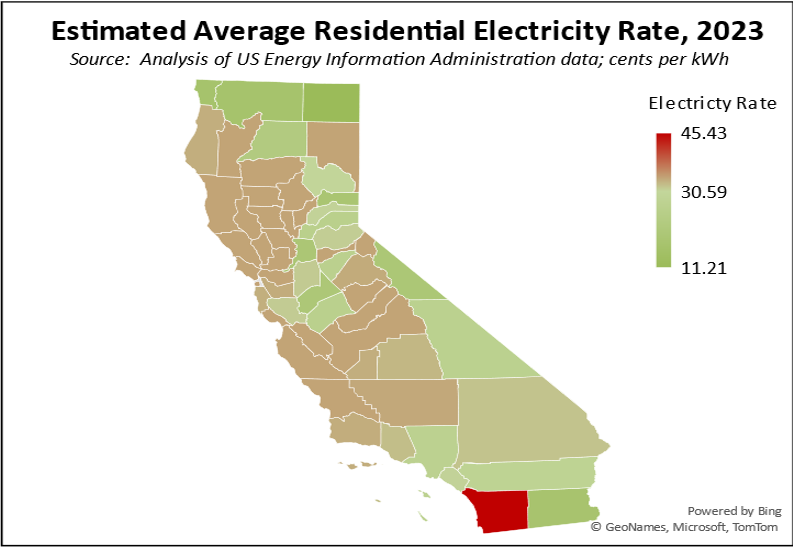
2023 Average Residential Electricity Rates
The Center’s data series for estimated average residential electricity rates has been updated for 2023 using the final year data from US Energy Information Administration. The full methodology and estimates are available now on the web site.
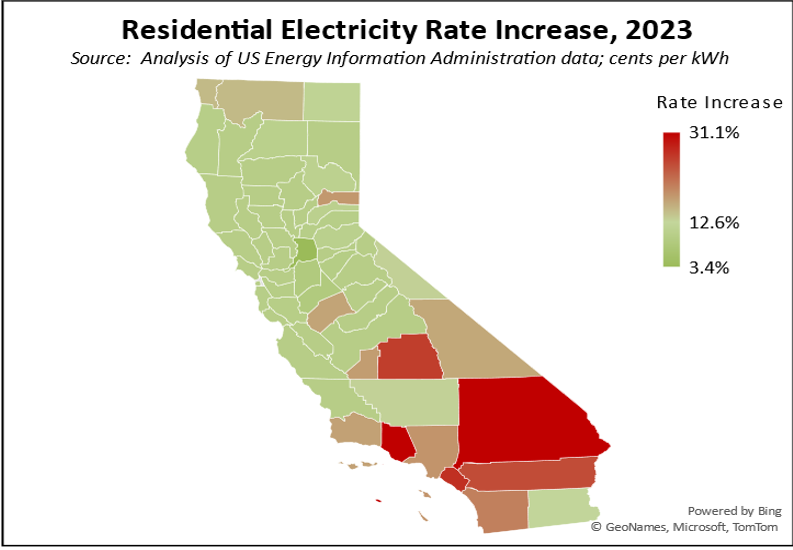
By county, average rate increases ranged from 3.4% in Sacramento County to 31.1% in both Ventura and San Bernardino Counties.
By legislative district, the 5 highest and lowest districts by both estimated 2023 average rate and rate increase are:
GHG Inventory Dips 2.4% in 2022
California’s soaring energy costs are largely driven by the state’s current climate change policies, which began in 2010 with the AB 32 Early Action Items. Given the increasing burden these rising costs place on households and employers, it is important to also review what the state is getting in return.
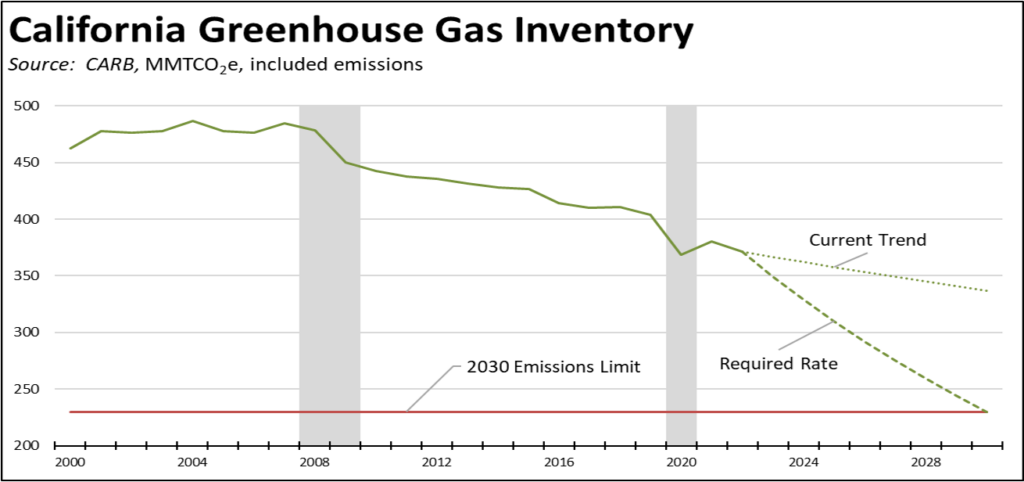
The primary indicator for this purpose is the Air Resources Board (CARB) annual GHG (greenhouse house gas) inventory, chronicling the change in total GHG emissions (all gases) expressed in CO2 equivalent. As indicated in the chart below, 4 key observations result from the current data:
- Total emissions in 2022 dropped 9.3 MMTCO2e, or 2.4%. Compared to pre-pandemic 2019, emissions were down 8.1% or an average 2.8% a year, reflecting the effects of the economic downturn on the emission outcomes.
- Putting aside the outlier pandemic period years in 2020 and 2021, emissions overall have dropped an average of only 1.2% annually since the beginning of the current program in 2010. If emissions continue to drop along this current trend, California will miss CARB’s target of 230 MMTCO2e by 2030 by nearly 50%. In other words, along current trends—both emission reductions and energy cost increases—California will not even attain the intended purpose of these substantial costs.
- In order to achieve the 2030 goal, emission reductions will have to be ramped up to 5.8% annually, or nearly 5 times the current rate. The question, though, is at what cost? CARB currently is pursuing additional regulations in an effort to accelerate the emission reductions. Just two of these—the pending low carbon fuel standard and Cap-and-Trade revisions—would cost Californians an additional $8.4 billion starting next year and rising every year after.
- Supporters of the current high regulation approach to the program often claim that California’s economic performance is somehow proof that high regulation and economic growth are compatible. The program results shown in the chart, however, show that economic downturns have been critical to the state’s emissions being as low as they are today. On average, emission reductions in normal years have only been 1.2%. The major shifts in the overall trend line instead came during the two recessionary periods (shaded areas) and the subsequent restructuring in the state economy in the periods after. The trend line dropped by 7.1% in the 2008 and 2009 recessionary years. It again dropped by another net 5.8% during the state-imposed job closure years of 2020 and 2021. Even the somewhat better outcome of 2.4% for 2022 came in a year when economic growth basically stalled in the state. In the recent revised data, real GDP in California grew only 0.9% in 2022, compared to 2.5% for the US and an overall average of 3.2% for California between 2010 and 2023. Using an emissions per unit of GDP factor, 75% of the emissions reductions in 2022 can be associated with the state performing below this longer term economic trend, and only the remaining 0.3% of reductions attributable to other factors such as the state’s regulations.
Reflecting the higher GDP growth for the nation overall, US EPA data shows total US gross emissions edged up 0.2% in 2022 compared to CARB’s 2.4% drop for California. Since 2010, US emissions were down 10.2% vs. CARB’s 16.1% for the state. In the longer term shown in the CARB data, US emissions fell 19.8% from 2000 compared to 14.5% for California, largely the result of the national shift from coal to natural gas and renewables but without California’s attendant high energy costs.
Overall, the CARB data shows the rising costs paid by Californians have reduced emissions by 71.4 MMTCO2e since 2010 and 91.8 MMTCO2e since 2000. These amounts are significant but have to be considered in perspective:
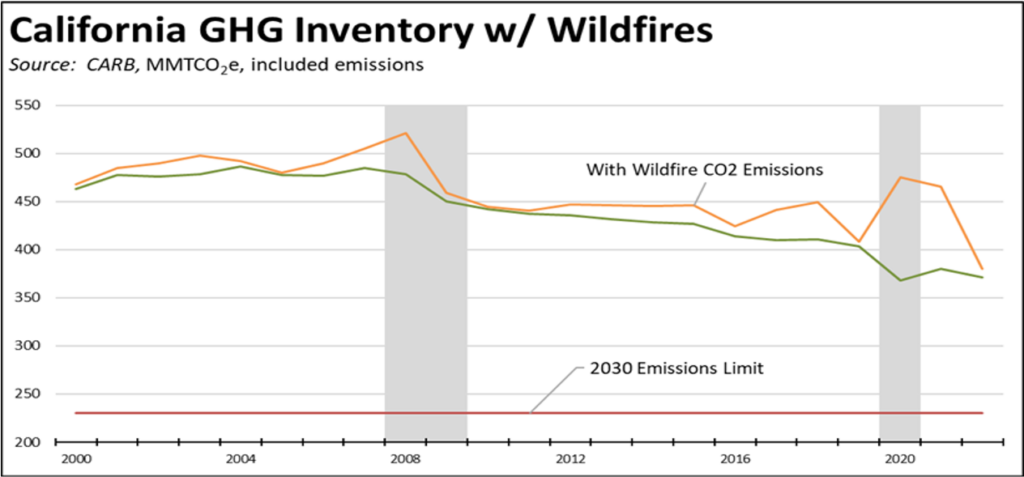
- Emission reductions have been overwhelmed by wildfire emissions in many years. Previous failures to properly manage forests and wildlands have erased any gains, with combined emissions above the previous emission peaks from all other sources in 6 of the last 23 years.
- Global emissions are growing faster, more than offsetting whatever California’s reductions are capable of achieving. In 2022 alone, total global emissions grew by 400.2 MMTCO2e, or more than California’s entire current inventory estimate. Since 2010, global emissions have grown by 6,153.5 MMTCO2e, or by nearly the equivalent of 17 Californias and more than the entire current inventory for the US. China alone has grown by 3,896.7 MMTCO2e in no small part to goods once produced in the US including the battery components, materials, and equipment required for California’s energy transition. California has not so much reduced its emissions but shifted where they occur.
- In light of these emissions realities, even former Governor Jerry Brown acknowledged that California’s efforts will have a negligible impact on the global scale. From this perspective, supporters of the current program approach have always maintained that the true value of California’s efforts was in developing models others could follow. But the cost of the state’s measures have seen few following its lead, and even for others to pull back including most recently Oregon and Virginia and potentially Washington. In recognition of this situation, the current proposed “Climate Bond” (Proposition 4) signals a shift in state policies, focussing on climate adaption rather than emission reduction measures as in prior efforts.
Inflation
July 2023
For the 12 months ending July, the California CPI rose 3.3%, the same as in June. In the same period, the US CPI went to 2.9% in July from 3.0% in June.
California Gasoline Taxes & Fees
Fees per Gallon
Of Gasoline
In September, California Energy Commission data indicates that $1.40 (31.5%) of the price of a gallon of regular gasoline was paid to cover state, local, and federal taxes and fees.
California vs. Rest of US Diesel Price
Above Other States
The September average price per gallon of diesel in California stayed level at $4.95. The California regulatory and tax premium above the average for the US other than California ($3.50) rose to $1.45, a 41.3% difference.
price
In September, California had the highest diesel price among the contiguous states and DC.
Range Between Highest and Lowest Prices by Region
above Other States
(Central Sierra Region)
The cost premium above the US (other than California) average price for regular gasoline ranged from $1.38 in the Inland Empire Region (average September price of $4.48), to $1.91 in Central Sierra Region (average September price of $5.01).

Highest/Lowest Fuel Prices by Legislative District:
California Residential Electricity Price
Rest of US
California average Residential Price for the 12 months ended July 2024 was 30.94 cents/kWh, 101.6% higher than the US average of 15.35 cents/kWh for all states other than California. California’s residential prices were the highest among the contiguous states and DC.
California Residential Electric Bill
For the 12 months ended July 2024, the average annual Residential electricity bill in California was $1,837, or 84.8% higher ($843) than the comparable bill in 2010 (the year the AB 32 implementation began with the Early Action items). In this same period, the average US (less CA) electricity bill for all the other states grew only 23.7% ($324).
In 2010, California had the 9th lowest residential electricity bill among the contiguous states and DC. In the latest data, it had the 10th highest.
Residential bills, however, vary widely by region. Transforming the 2022 data recently released by the Energy Commission, estimated annual household usage is as much as 82% higher in the interior regions compared to the milder climate coastal areas, and substantially higher when comparing across counties.
for Rest of US
For the 12 months ended July 2024, California’s higher electricity prices translated into Residential ratepayers paying $13.1 billion more than the average ratepayers elsewhere in the US using the same amount of energy. Compared to the lowest cost state, California households paid $16.4 billion more.
California Commercial Electricity Price
Rest of US
California average Commercial Price for the 12 months ended July 2024 was 25.10 cents/kWh, 112.4% higher than the US average of 11.82 cents/kWh for all states other than California. California’s commercial prices were the highest among the contiguous states and DC.
California Industrial Electricity Price
Rest of US
California average Industrial Price for the 12 months ended July 2024 was 20.62 cents/kWh, 171.0% higher than the US average of 7.61 cents/kWh for all states other than California. California’s industrial prices were the highest among the contiguous states and DC.
for Rest of US
For the 12 months ended July 2024, California’s higher electricity prices translated into Commercial & Industrial ratepayers paying $20.7 billion more than ratepayers elsewhere in the US using the same amount of energy. Compared to the lowest rate states, Commercial & Industrial ratepayers paid $26.4 billion more.
California Natural Gas Prices
Average prices ($ per thousand cubic feet; 12-month moving average) for the 12 months ended July 2024 and changes from the previous 12-month period for each end user: